Figure 8.
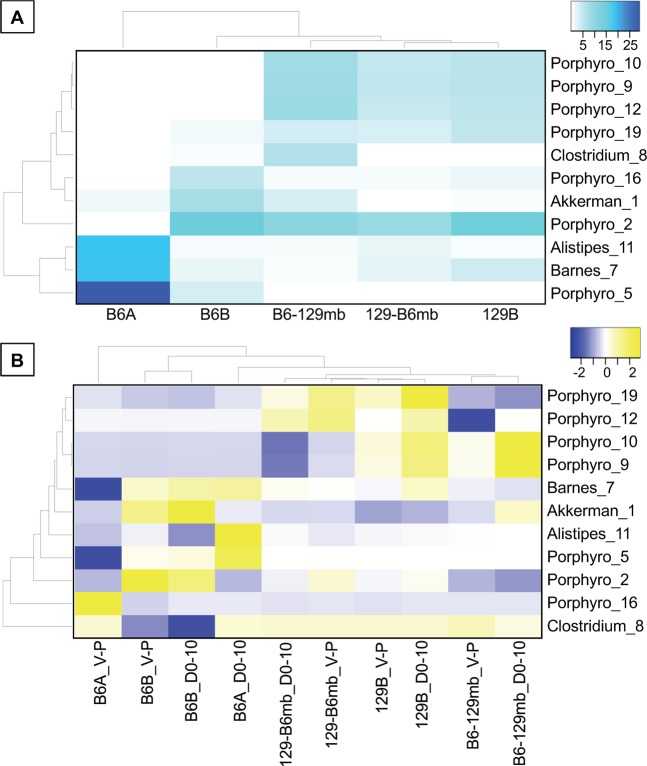
Heat Maps of the Abundant Bacterial OTUs. Heat Maps of the Abundant Bacterial OTUs. (A). Heat map of the abundant fecal bacterial OTUs from the genotype-microbiota mouse groups at Day 0 (before Pac was administered). Values in the cells are relative abundances of the bacteria, and only those OTUs with greater than 2% average relative abundance are shown. (B) Heat map of the Pac-induced differences in the abundant fecal bacterial OTUs from the genotype-microbiota mouse groups. Values in the cells are the differences in mean relative abundances of the bacteria where: V-P = Veh minus Pac and D0-10 = Pac at D0 minus Pac at D10. Heat maps were clustered on both axes. Number of replicates for each genotype-microbiota group are shown in Fig. 7. Bacterial taxa abbreviations are: Porphyro, Porphyromonadaceae; Clostridium, Clostridium aerotolerans; Akkerman, Akkermansia muciniphila; Alistipes, Alistipes onderdonkii; Barnes, Barnesiella; and the numbers following the underscores indicate the OTU numbers.

