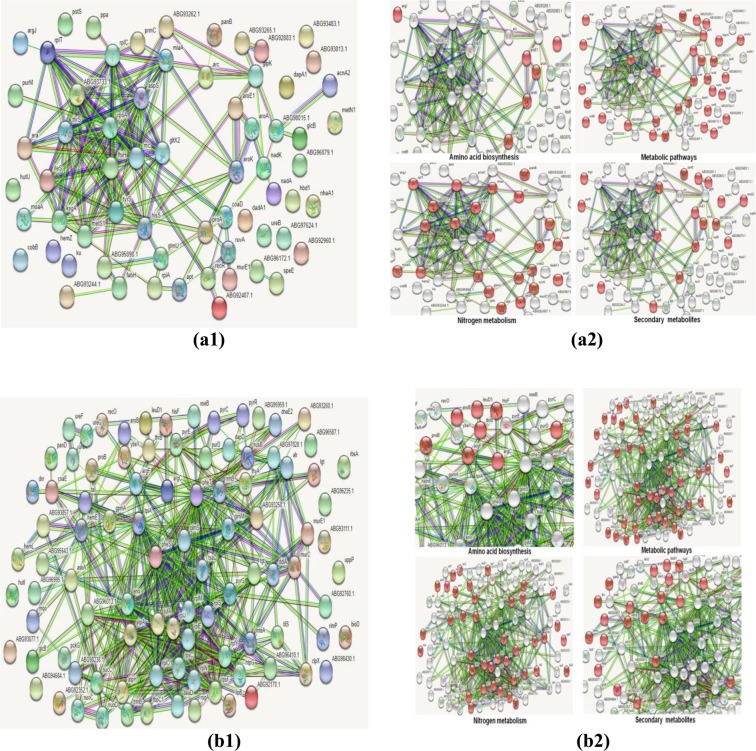
Figure 2.
Protein-Protein Interaction (PPI) networks of differentially expressed proteins (with 2-fold or greater change) in NB (a) and BM (b). The networks a1 & b1 represent the total proteins expressed while a2 & b2 highlight the proteins involves in various processes. The protein-protein interactions were analyzed using the String database (version 9.1, Available online: http://string-db.org/) with the confidence score > 0.7. The analysis was performed in triplicates on the average value of proteins obtained from three replicates of the experiment.

