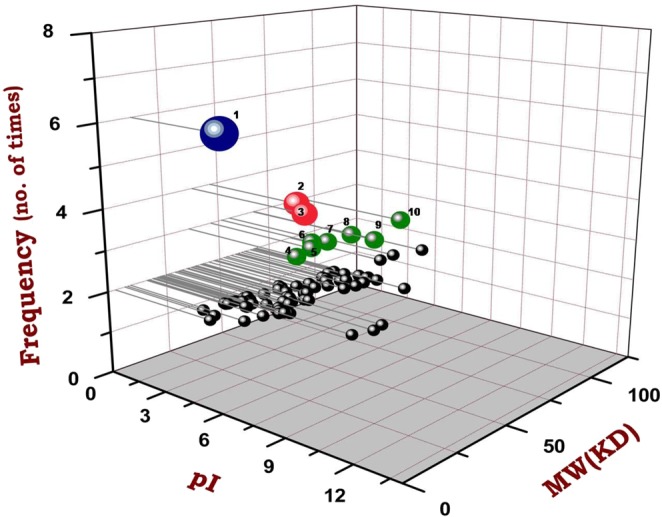
Figure 4.

3D Scatter plot illustrating the expressional pattern of the proteins associated with low-temperature N2 fixation. OriginPro software was used to perform the analysis based on the Isoelectric point of the proteins (pI), molecular weight (KD) and their frequency to occur as observed during previous studies. Proteins with ≥ 3 time of occurrence are numbered viz. 1, CowN; 2, Eno; 3, PyrG; 4, IlvC; 5, ClpX; 6, MnmE; 7, AtpA; 8, HtpG; 9, MutL; 10, IleS.
