Figure 5.
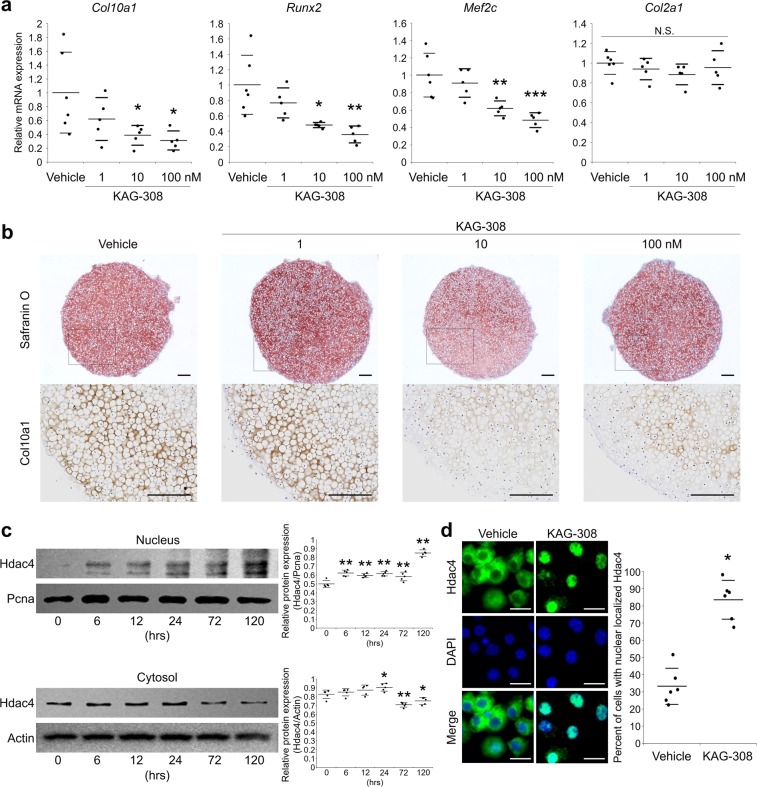
Effects of KAG-308 on chondrocyte hypertrophy in vitro. (a) mRNA levels of Col10a1, Runx2, Mef2c, and Col2a1 in pellet culture of mouse articular chondrocytes treated with indicated concentration of KAG-308 for 2 wks. Symbols represent individual pellets; long and short bars show the mean and SD, respectively. *P < 0.05, **P < 0.005, ***P < 0.0005 vs vehicle by ANOVA followed by Dunnett’s post hoc test. (b) Safranin O staining and Col10a1 immunostaining of cultured pellets of mouse articular chondrocytes treated with KAG-308 for 2 wks. Inset boxes in safranin-O staining indicate enlarged images. Scale bar, 200 µm. (c) Immunoblotting of Hdac4 in nuclear and cytosolic fractions from mouse articular chondrocytes in a time course with 10 nM KAG-308 treatment. Right graphs indicate quantitative densitometry analysis of the immunoblots (n = 5). Hdac4 values were normalized to Pcna (nuclear) or Actin (cytosol). Long and short bars show the mean and SD, respectively. *P < 0.05, **P < 0.005 vs 0 hour by ANOVA followed by Dunnett’s post hoc test. (d) Immunocytochemistry of Hdac4 in mouse articular chondrocytes after 4-d-culture in BMP-2-containing medium with vehicle or 10 nM KAG-308. Right graph shows the percent of cells with nuclear-localized Hdac4. Symbols represent independent slides; long and short bars show the mean and SD, respectively. *P < 0.0005 by Welch’s t test. Scale bar, 20 µm.

