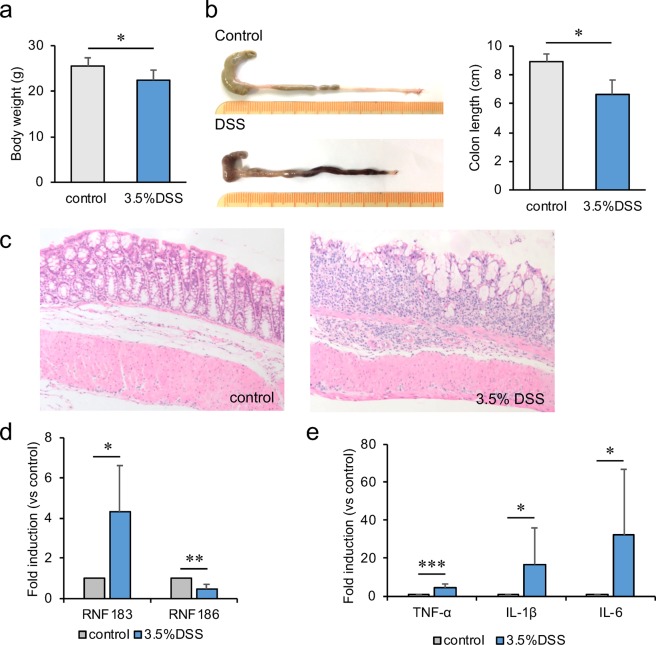
Figure 1.
RNF183 expression in the dextran sulfate sodium (DSS)-induced colitis mouse model. (a) Changes in body weight and (b) colon length between the control (water) and DSS-treated mice after 5 days exposure. Asterisks represent significant differences (n = 6; Student’s t-test, *p < 0.05). (c) Haematoxylin-eosin (HE) staining of mouse colon tissue exposed to control (water) and 3.5% DSS for 5 days ( × 20 magnification). (d) Expression of RNF183 and RNF186 mRNA in whole colon tissues between control and 3.5% DSS-treated mice at 5 days. (e) The mRNA levels of inflammatory markers in whole colon tissues between control and 3.5% DSS-treated mice at 5 days. The expression levels were determined by quantitative reverse transcription polymerase chain reaction (qRT-PCR) Asterisks represent significant differences (n = 6; paired t-test, *p < 0.05, **p < 0.01, ***p < 0.001).

