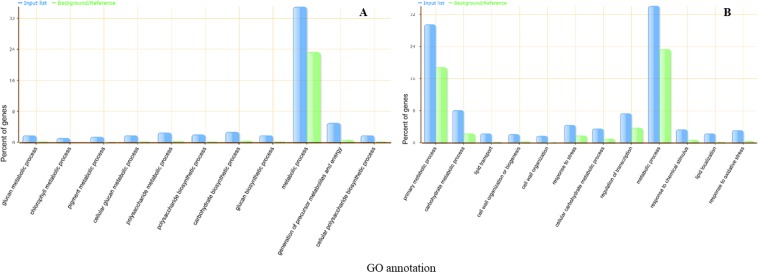
Figure 3.
Over represented GO terms for DEGs of OPT compare to FP in biological process category. (A) GO terms of up-regulated genes. (B) GO term of down-regulated genes. GO terms are analyzed by AgriGO, a web-based tool, as described in the methods. The Y-axis is the percentage for the input DEGs in different GO terms calculated by the number of genes mapped to the GO terms divided by the number of all input genes. The same calculation was applied to the reference list to generate its percentage. The input lists are represented by blue color, while the reference lists are represented by green color. The X -axis is the definition of GO terms.

