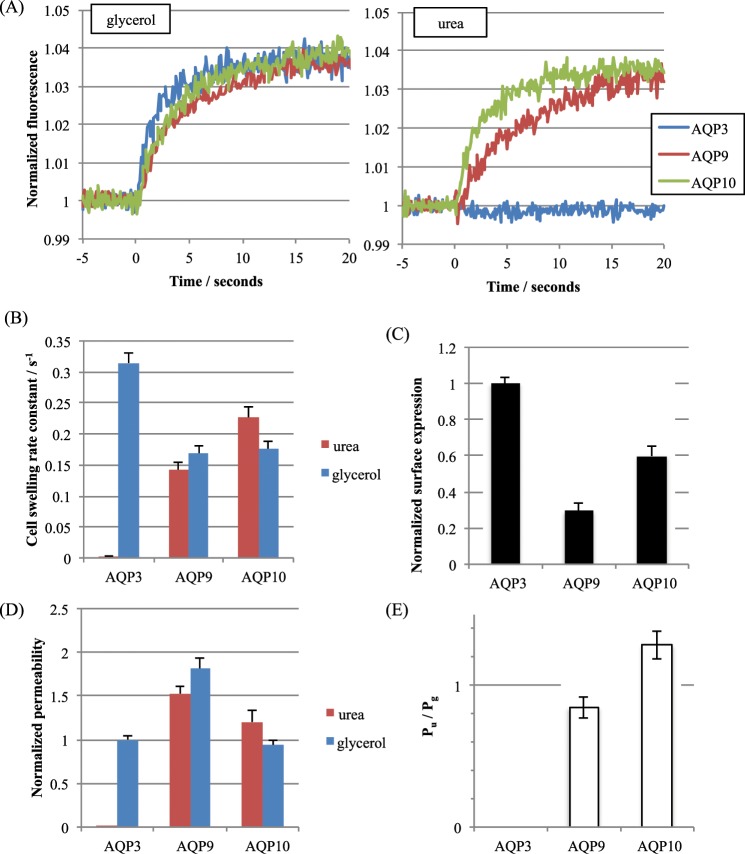
Figure 4.
Relative single channel glycerol and urea permeabilities of AQPs 3, 9 and 10. (A) Representative calcein fluorescence quenching curves for human AQPs 3, 9 and 10 for glycerol and urea permeability. (B) Average cell swelling rate constants from fits to calcein fluorescence timeseries data. (C) Surface expression of GFP-tagged AQPs 3, 9 and 10 in HEK293 cells measured by cell surface biotinylation followed by ELISA with an anti-GFP antibody. (D) Relative single channel solute permeabilities of AQPs 3, 9 and 10 calculated by normalizing the cell swelling rate constant to surface expression and then to AQP3 glycerol permeability. (E) Ratio of urea permeability to glycerol permeability for AQPs 3, 9 and 10. This figure is reproduced from P. Kitchen PhD thesis35.

