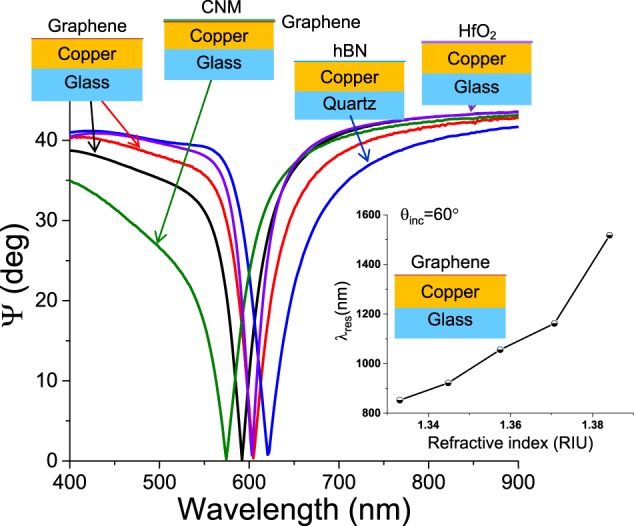
Figure 2.

Protection of plasmonic properties of metals using various materials. SPR curves measured in Cu protected by SLG. Red and black curves correspond to P1, P1; blue, hBN, purple 10 nm HfO2, green SLG and Carbon Nanomembrane (see Methods). All curves are measured in the attenuated total reflection geometry in air. The Cu thickness for all samples is 43.5 nm. The inset plots the spectral position of the SPR minimum as a function of the refractive index of the medium contacting the SLG protected Cu structure.
