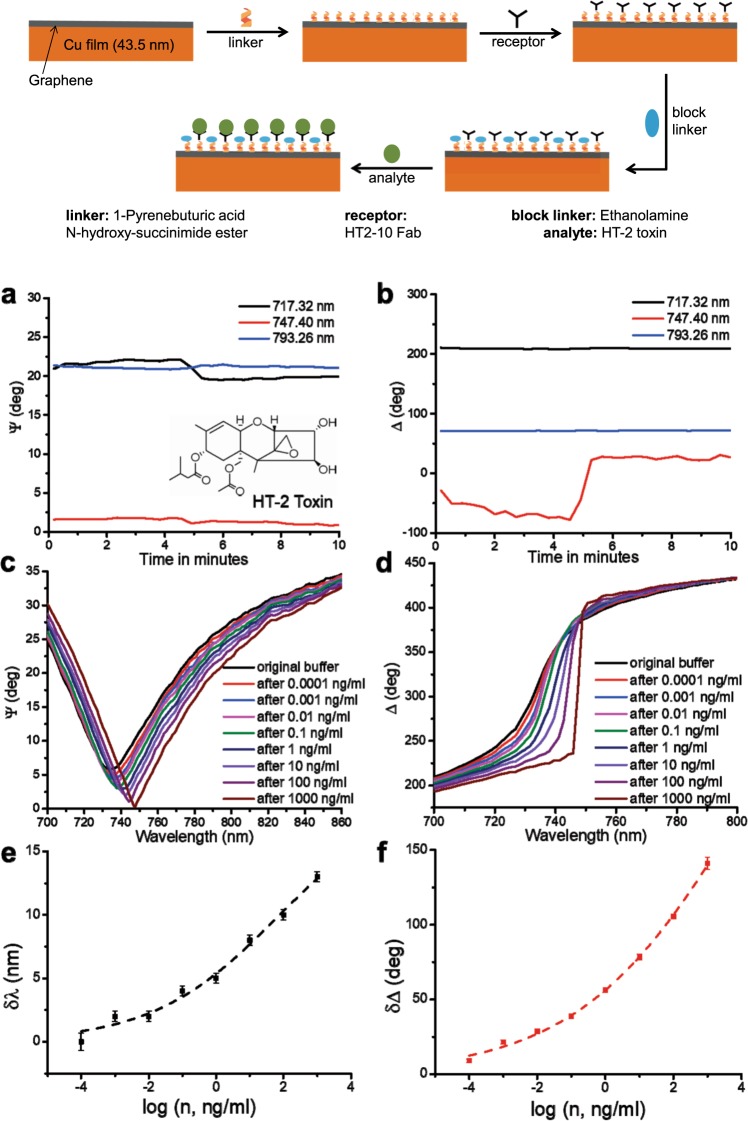
Figure 3.
Graphene protected Cu SPR biosensing of HT-2. (a,b) Ellipsometric parameters ψ (amplitude) and Δ (phase) of the SPR curve of functionalized SLG protected Cu chips at 717.32, 747.40 and 793.26 nm, as a function of time when the sensor chip reacts with HT-2. The pumping time of PBS is~4.5 mins. The inset in (a) shows the molecular structure of HT-2. (c,d) SPR spectral curves after reacting with different concentrations of HT-2 in PBS. (e,f) The shift of resonant wavelength (δλ) for ψ and the change of phase (δΔ) as a function of logarithm of concentration, n, of HT-2. The dark dashed line shows the sigmoidal fit of δλ as a function of log(n), and the red dashed line is the same for δΔ, giving nH = 0.2 ± 0.01 and KH > 1 µg/mL. The top inset schematically describes the protocol of SLG functionalization for HT-2 bio-sensing.

