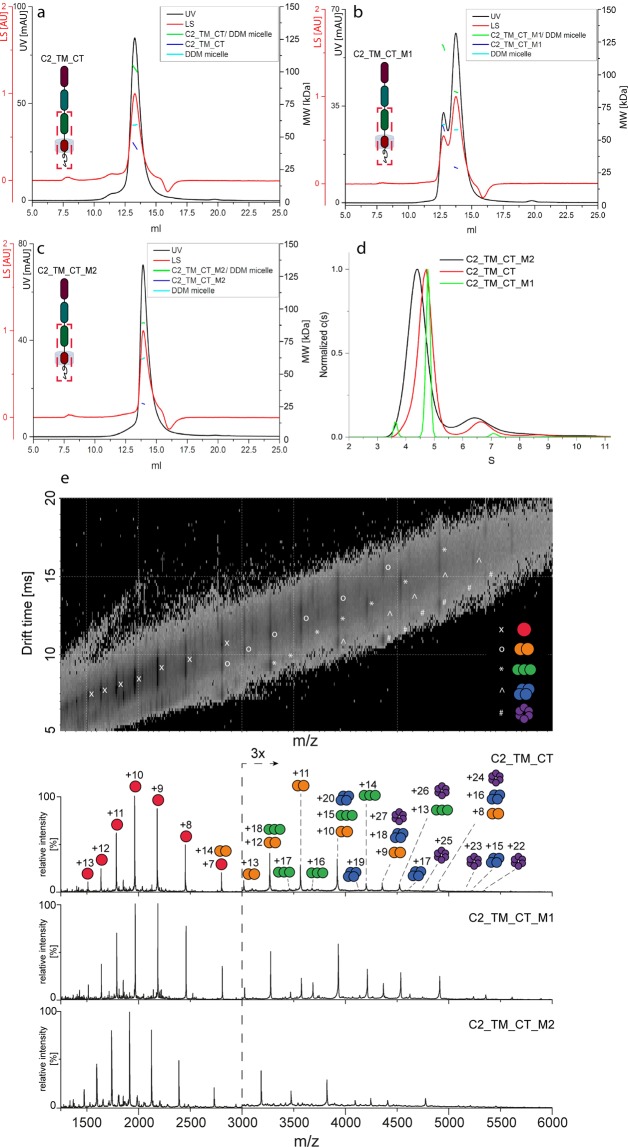
Figure 6.
SEC-MALS, AUC and native MS analysis of C2_TM_CT wild-type and mutants. (a) SEC-MALS of C2_TM_CT. (b) SEC-MALS of C2_TM_CT_M1. (c) SEC-MALS of C2_TM_CT_M2. Chromatograms show the detector readings of the LS and UV in red and black, respectively. Scales for LS and UV detectors are shown in the left-hand axis; and calculated molecular mass on the right-hand axis. (d) AUC (sedimentation velocity profiles) of C2_TM_CT and mutants. (e) Native mass spectra of C2_TM_CT wild-type and the mutant variants (1 & 2) solubilized in DDM micelles with the 2D drift plot of the wild-type in the top panel. In the case of overlapping oligomeric species, the drift plot can help to identify the correct oligomeric states that are represented by the same m/z peak. Monomeric and oligomeric species including their charge states are assigned accordingly. Corresponding peaks of C2_TM_CT_M2 are slightly shifted to lower m/z values due to the deletion of six amino acids.

