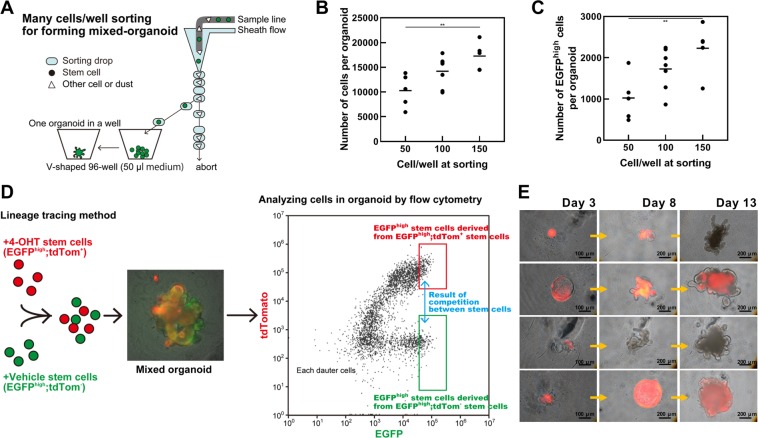
Figure 5.
Strategy of forming mixed organoids. (A) Schematic of the “mixed culture by direct sorting” procedure for forming one organoid derived from many stem cells. (B,C) Numbers of total (B) and Lgr5-enhanced green fluorescent protein (EGFP)high (C) cells in organoids at Day 9 depend on the initial number of stem cells. Closed circles indicate individual organoids and black bars show their average (**P < 0.01, Tukey-Kramer). (D) Strategy of forming mixed organoids derived from two-color stem cells and their analysis. (E) Representative images of organoid growth. The scale bar shows 100 or 200 µm. The organoid was rotated because medium was added between days 4 and 5.

