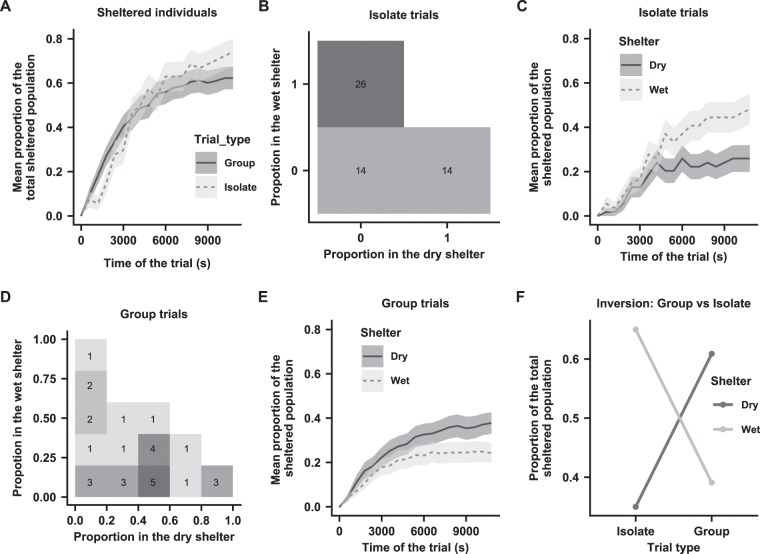
Figure 1.
(A) Mean and standard error of the proportion of sheltered individuals over time (s) in the isolate (light grey) and group (dark grey) trials. (B) Two-dimensional histogram of the total proportion of the isolated individuals in the DS and WS at the end of the experiment. (C) Mean and standard error of the proportion of sheltered individuals over time (s) inside the WS (light grey) and the DS (dark grey) for the isolate trials. (D) Two-dimensional histogram of the total proportions of the groups in the DS and WS at the end of the experiment. (E) Mean and standard error of the proportion of sheltered individuals over time (s) inside the WS (light grey) and the DS (dark grey) for the group trials. (F) Proportion of all individuals choosing the DS (dark grey) and WS (light grey) at the end of the trials for the isolated individuals and the groups.

