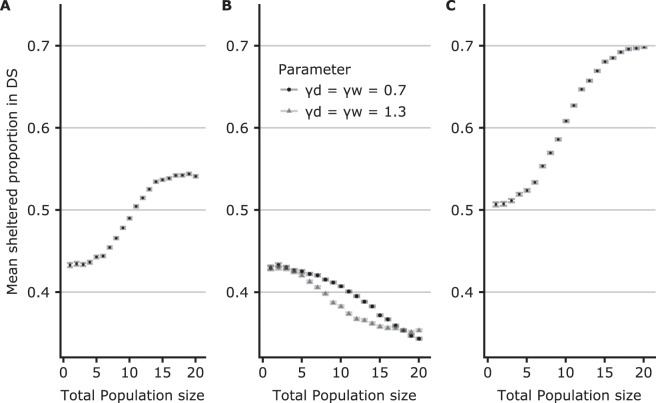
Figure 4.
(A–D) Mean simulated (50000 realisations) proportions of sheltered individuals in the DS defined by Eqs. 5–11. (A) Experimental parameter values (αd = 0.43; γd = 1.3; γw = 0.7). (B) Same strengths of social interactions between the shelters: Black dots (αa = 0.43; γd = 1.3; γw = 1.3); Grey triangles (αd = 0.43; γd = 0.7; γw = 0.7). (C) Same individual shelter preferences for a shelter (αd = 0.5; γd = 1.3; γw = 0.7). Other experimental parameter values: ζ = 0.0133; Le = 0.014; Lc = 0.000031.

