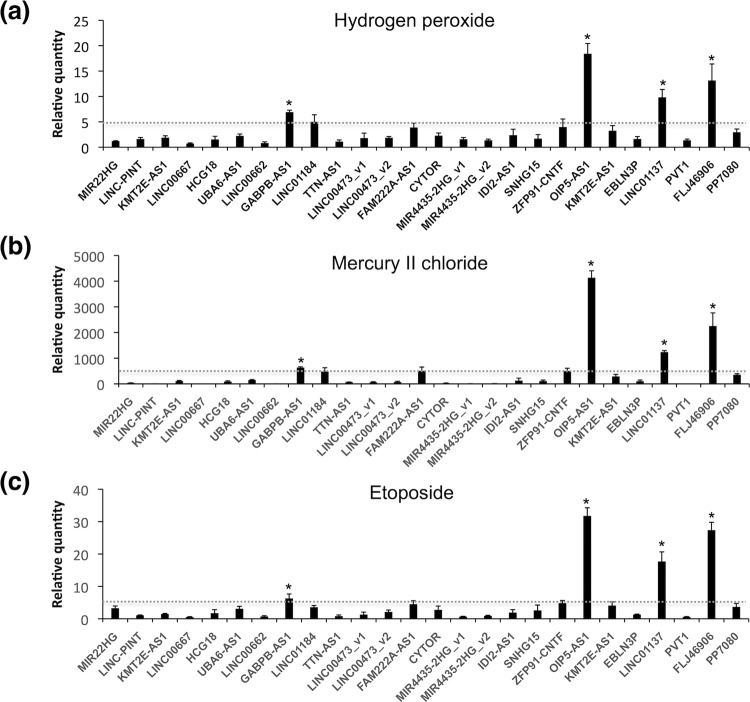
Figure 1.
Exposure to chemical stressors altered the levels of lncRNA expression. Following treatment of HepG2 cells with 100 μM (a) hydrogen peroxide, (b) mercury II chloride, or (c) etoposide for 24 hours, RT-qPCR was performed to determine the expression levels of the indicated RNAs normalized relative to GAPDH, ACTB, HPRT1, and PGK1. All values are means ± SD from four independent experiments (*P < 0.05, Student’s t test). The expression levels of treated cells divided by those of untreated cells are shown on y-axis, so a value of 0 indicates that the RNA could not be detected, while a value of 1 indicates no change in expression level compared to untreated controls. Gray dotted lines indicated cut-off values.

