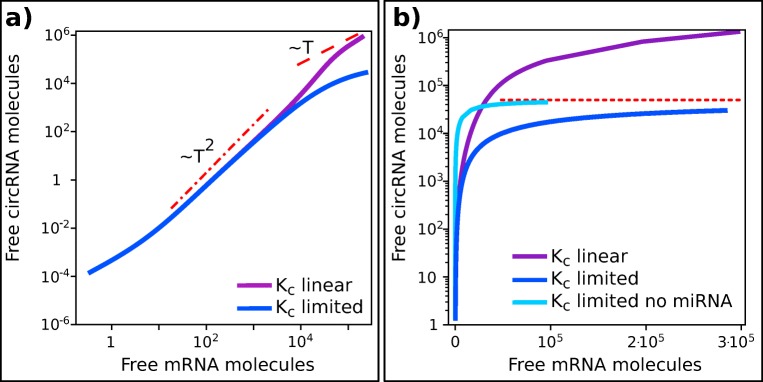
Fig. 6.
CeRNAs levels as a function of mRNA production rate. Figure shows the predicted level of free circRNA as a function of the linear transcript for the model presented in Fig. 5a for two different functional forms of KC(T). a Linear dependency of circRNA production rate on T and Hill-like functional form (limiting reagent) are highly similar in a broad range of values of T (purple and blue lines respectively as in legend). For intermediate values of T both the models give an increase of C that is slightly less than quadratic (dashed-dotted red line) while for large T the two models diverge: the first model increases linearly (red dashed line), while limiting-reagent model shows a sublinear growth of C. b Same data as in panel (a) are plotted in semi-log scale. It is evident that limiting reagent model (blue continuous line) tend to a threshold value (dotted red line), while C increases continuously in linear model (continuous purple line). Note that the behavior of C at intermediate transcription rates is determined by the presence of miRNA. In fact, absence of miRNA implies a faster increase of C towards its limit value (light blue continuous line). All the parameters are maintained constant in the two models, decay rate of T is rescaled in order to make the models comparable. In the limiting model KC has been chosen in order to have 𝜖lim/TQ = 𝜖linear ensuring that C production rate at low T is identical in the two models

