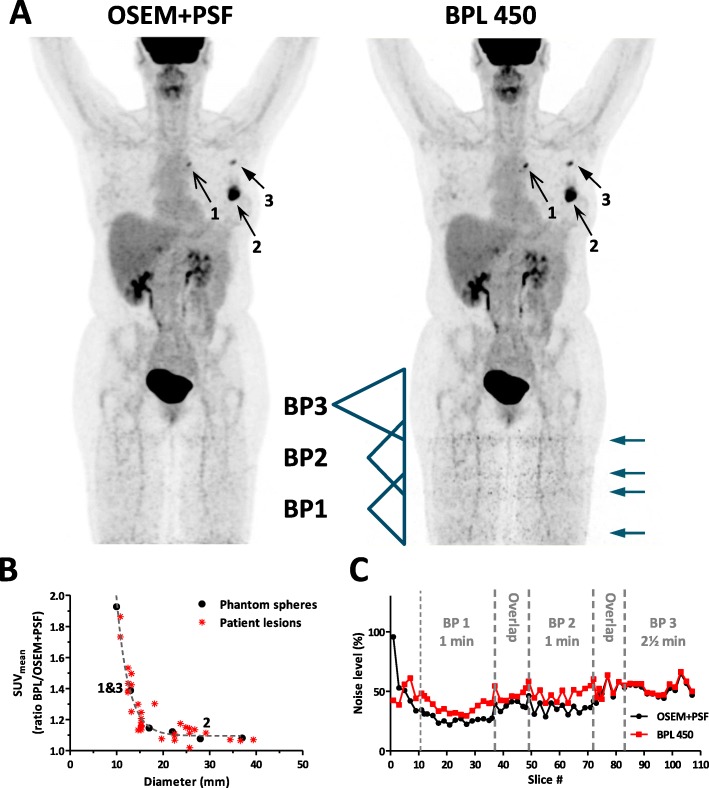
Fig. 3.
Lesion detectability and noise levels per slice in patient studies. a.) Representative 18F-FDG PET/CT patient study reconstructed by OSEM+PSF and BPL 450. Indicated are three lesions of different sizes (numbered arrows) and the position of three BPs, sensitivity (indicated by the triangle), and their overlap region. The acquisition times are different: BP1 & BP2 (1 min/bed) and BP3 (2½ min/bed). ‘Noise bands’ in the legs are indicated by arrows. b.) Ratio of the SUVmean of N = 33 lesions from N = 8 patients measured in reconstructions from BPL 450 and OSEM+PSF. In addition, the ratios are given for the 6 spheres of the NEMA as measured in Fig. 1c. The three lesions of A.) are indicated in the graph. A single exponential decay was fitted to both data sets showing an agreement of R2 = 0.917. c.) Noise levels per slice, defined as the SD/mean of a ROI drawn in muscle tissue, are given for the 3 BPs of the patient scan indicated in A.). Acquisition times per BP as well as overlap regions of 11 slices between two BPs are indicated

