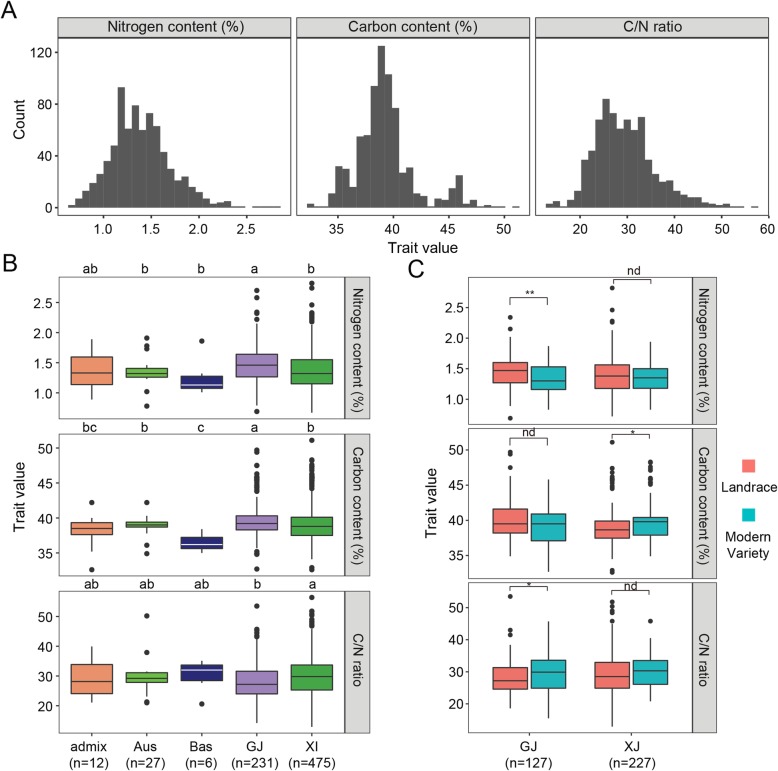
Fig. 1.
Grain nitrogen content (GNC), grain carbon content (GCC), and the C/N ratio of milled rice and correlations among these traits in rice subgroups. a Phenotypic distribution of the GNC, GCC, and C/N ratio in the whole population. b The GNC, GCC, and C/N ratio in five rice subgroups. Different letters above the boxplots indicate significant differences among subgroups (P < 0.05) based on Duncan’s test. c Differences in the GNC, GCC, and C/N ratio between landraces and modern varieties in the GJ and XI subgroups. *, **, and nd indicate significant differences at P < 0.05, P < 0.01, and no significant difference, respectively (Student’s t-test)

