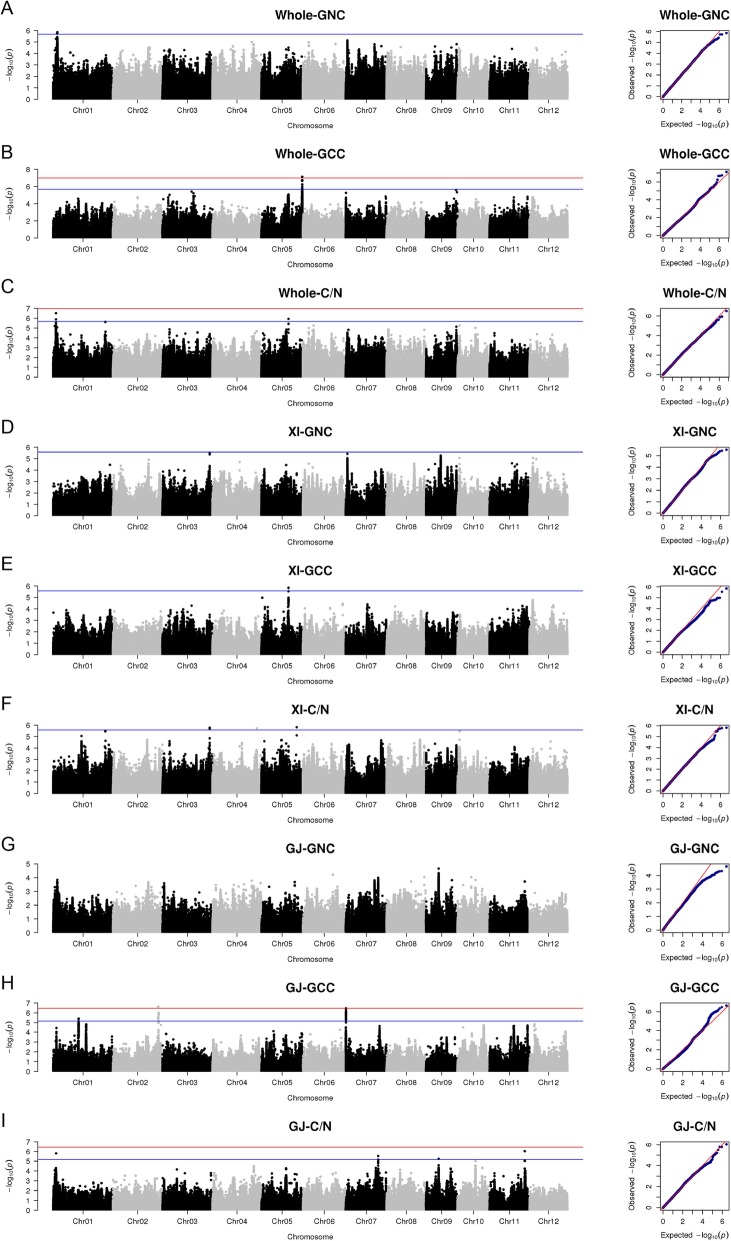
Fig. 2.
Manhattan and quantile-quantile plots for the single-locus GWAS. a Grain nitrogen content (NC), (b) grain carbon content (CC), and (c) the C/N ratio for the whole GWAS panel. d NC, (e) CC, and (f) the C/N ratio for the XI GWAS panel. g NC, (h) CC, and (i) the C/N ratio for the GJ GWAS panel. The points in the Manhattan plots indicate the −log10(P) value. The horizontal red and blue lines indicate the significant and suggestive thresholds calculated as follows: 0.05 and 1 divided by the effective number of independent markers in the GWAS panel, respectively

