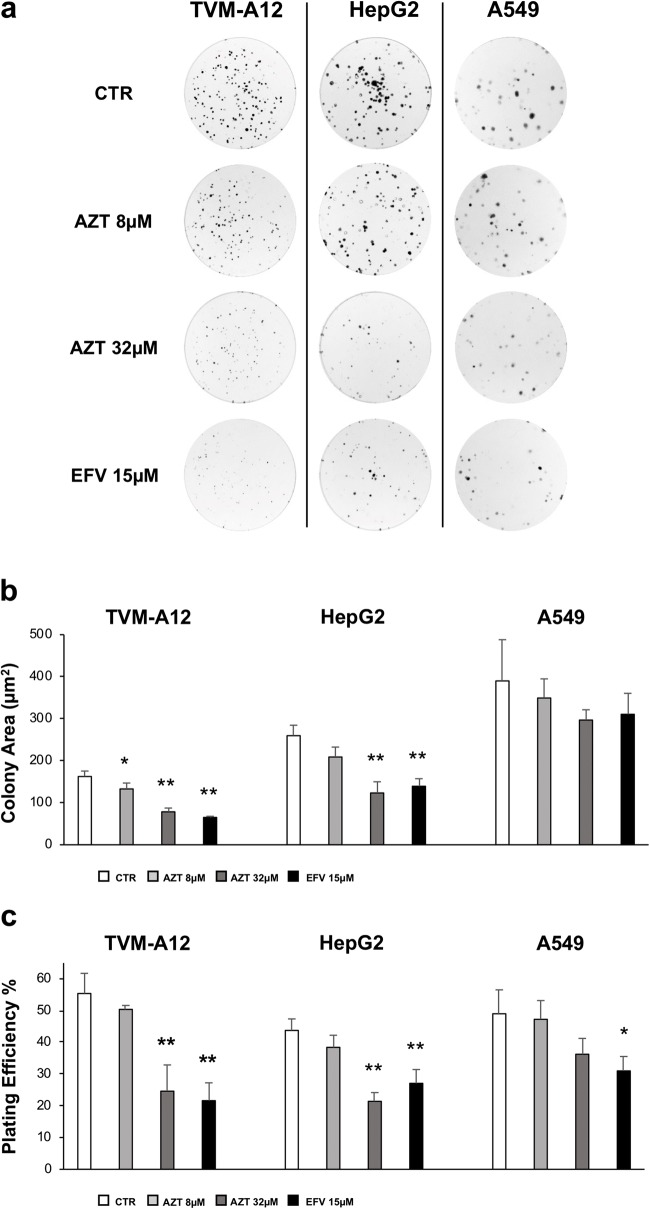
Fig. 3.
Analysis of the effect of the antiretroviral treatment on colony-forming ability. a Colony-forming ability was assessed in TVM-A12, HepG2 and A549 cells, after 10 days of treatment with AZT (8 and 32 μM) and EFV (15 μM); images of a representative experiment of at least three performed. b Plating efficiency (PE) calculated for each condition as described in materials and methods. c Size of colonies were calculated using OpenCFU software. (*) p ≤ 0.050 or (**) p < 0.001 indicates significant difference compared to untreated cells (CTR). Data are shown as mean ± SD of at least three experiment performed

