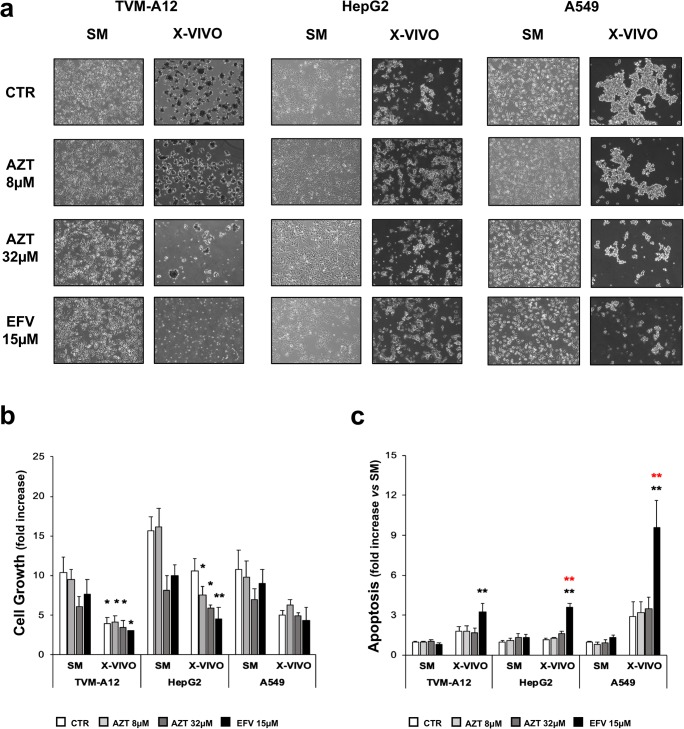
Fig. 4.
Analysis of the effect of antiretroviral drugs treatment on the sphere-like aggregates formation, cell growth and apoptosis. a Phase contrast microscopy images of adherent cells and grape-like cellular aggregates of TVM-A12, HepG2 and A549 treated with antiretroviral drugs. b Cell growth analyzed by trypan blue dye exclusion test expressed as fold increase respect to seeded cell number. c Apoptosis evaluated by flow cytometry analysis of DNA fragmentation and expressed as fold increase respect to untreated cells in SM. Black asterisks represent comparisons to the untreated control in SM. Red asterisks represent comparisons to the untreated control in X-VIVO. (*) p ≤ 0.050 or (**) p < 0.001. Data are shown as mean ± SE of at least three experiments performed

