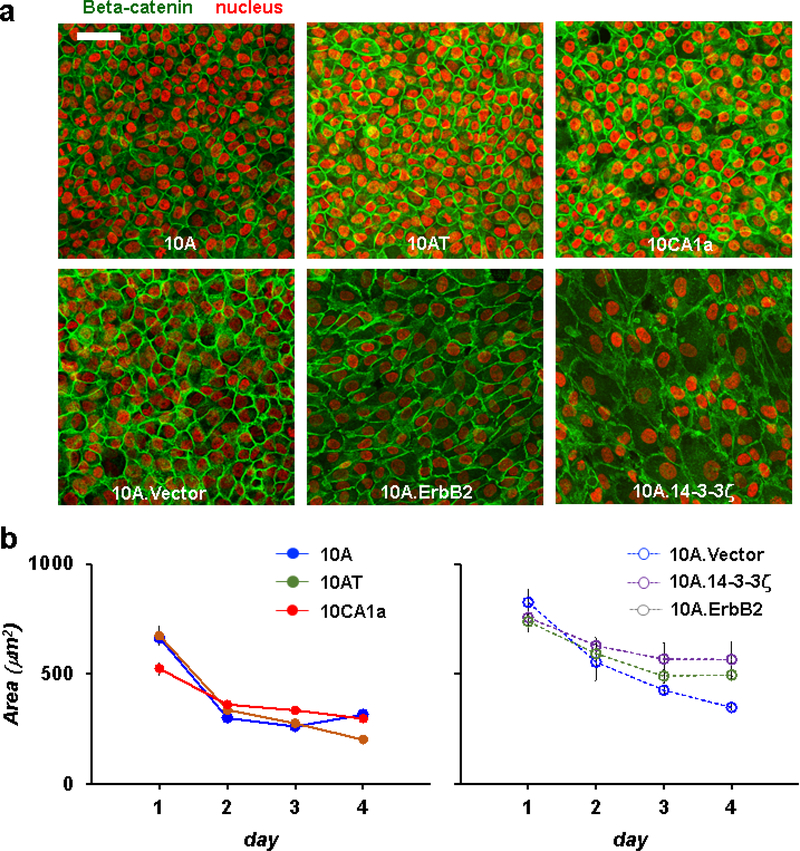
Figure 1. Confluent layers of six breast carcinoma cell lines with graded degree of invasive potential.
a. MCF10A cell lines at day 3 stained with DAPI (red) and beta-catenin (green). All cell layers became fully confluent by day 3 of cell culture. Scale bar = 50μm. b. Left panel: time dependence of cell area from control epithelial 10A cells (filled blue), tumorigenic but less invasive 10AT cells (mocha) and invasive 10CA1a cells (red) (Each datum pools all cells from 6~7 fields of view for a given day of cell culture). Right panel: time dependence of cell area from control epithelial 10A.vector cells (open blue), non-invasive 10A.14–3-3ζ cells (purple) and tumorigenic but less invasive 10A.ErbB2 cells (clover green). Cell area decreases with increasing days of cell culture but plateaued at day 3 for most of cell lines. Error bars represent the standard error of the mean.

