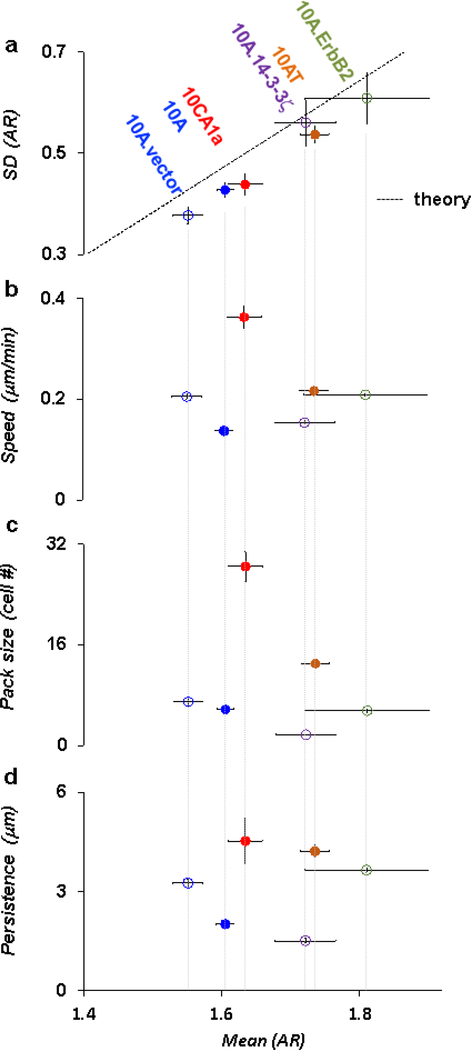
Figure 2. Structural signatures of cell layer unjamming and migratory dynamics.
a. AR and SD (AR) of breast carcinoma model cell lines at culture day 3 (colored). Each datum pools all cells from 6~7 field of views for a given day of cell culture. Solid line depicts the theoretical prediction of cell unjamming [1]. Carcinoma cell lines aligned roughly with transforming potential along the unjamming line, the notable exception being 10CA1a. Compared to control 10A.vector cells (open blue), 10A.ErbB2 (clover green) and 10A.14–3-3ζ (purple) cells tended to be more elongated (p = 0.015 and a.d. = 16% for AR between 10A.vector vs. 10A.ErbB2, p = 0.005 and a.d. = 11% between 10A.vector vs. 10A.14–3-3ζ). Compared to control 10A cells (filled blue), 10AT cells (mocha) tended to be elongated (p < 0.0005 and a.d. = 8% for AR, 10A vs. 10AT), but 10CA1a cells (red) were not significantly elongated (p = 0.32 and a.d. = 2% for AR,10A vs. 10CA1a). Each datum represents 800~1500 cells measured in 6 fields of view for each cell type. b. For most of cell lines except for 10AT, migratory dynamics did not conform with expectations based on structural signatures. For tumorigenic but less invasive 10AT cells, migratory dynamics changed in concert with expectations based on structural signatures; as AR and SD (AR) progressively increased in tandem, cellular speeds progressively increased as well (p < 0.0005 and a.d. = 45% for speeds between 10A and 10AT). For tumorigenic but less invasive 10A.ErbB2 cells, however, structures at day 3 signified a more unjammed state than the control vector whereas migratory dynamics did not change significantly (p = 0.28 and a.d. = 2% for speeds between 10A.vector and 10A.ErbB2). For 10A.14–3-3ζ cells, which tend to be non-invasive and lack E-cadherin [12], structures signified a more unjammed state than the control vector whereas cellular speeds were lower (p < 0.0005 and a.d. = 29% for speed between 10A.vector and 10A.14–3-3ζ). For the highly invasive 10CA1a cells, structures signified a moderately jammed state whereas cellular speeds were excessively high and therefore discordant again with structures (p < 0.0005 and a.d. = 90% for speed between 10A and 10CA1a). c. Compared to control epithelial cells, 10AT cells that exhibited faster migratory dynamics showed larger cooperative pack sizes (p < 0.0005 and a.d. = 77% for pack sizes between 10A.vector and 10AT). 10A.14–3-3ζ cells that exhibited slower migratory dynamics also showed smaller cooperative pack sizes (p < 0.0005 and a.d. =120% for pack sizes between 10A.vector and 10A.14–3-3ζ). 10CA1a cells, which exhibited inordinately fast migratory dynamics, showed anomalously large pack sizes (p < 0.0005 and a.d. = 132% between10CA1a and 10A). Each datum represents averages of 6 movies over 300min time-window for each cell type. d. Persistence in migratory dynamics exhibited poor correspondence with structures. Error bars in a,b,c,d represent the standard error of the mean.

