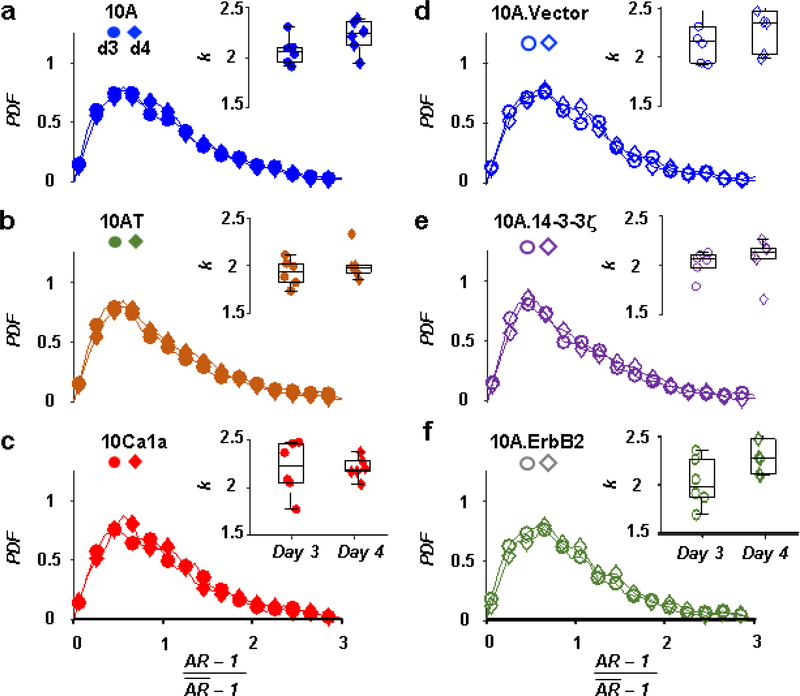
Figure 3. Across different carcinoma model lines, shape variability collapses to a family of PDFs that is common to all.
a-f. PDFs of the rescaled parameter x = (AR − 1) / (< AR > −1) of breast carcinoma model cell lines at days 3 and 4, where < ⋯ > denotes the mean, followed a k-gamma distribution (average k = 2.13 ± 0.26, p = 0.371 for difference in k between cell lines). Insets: k estimated for each cell line and culture day (Each datum represents a fitted k value determined by maximum likelihood estimation, for each individual field of view).

