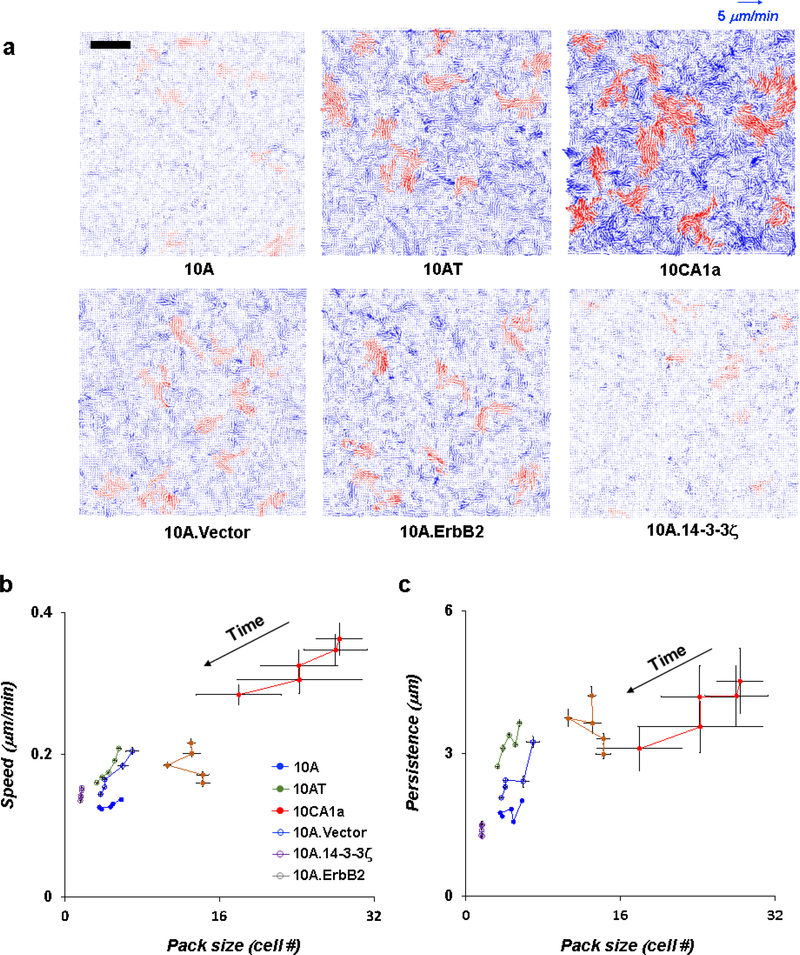
Figure 4. Faster migratory dynamics are accompanied by larger cooperative packs.
a. Speed maps of carcinoma model cell lines (at day 3). Cellular motions were seen to organize into oriented migratory packs. Velocity vectors (blue) are shown for 15min of period, with members of the 10 largest cooperative packs highlighted in red for each movie. Scale bar is 200μm. b. Speed and cooperative pack sizes in migratory dynamics measured for 25hrs at day 3 of cell culture. Six movies were analyzed for each cell type. For analysis, each 25hrs movie was divided into five 300min time-windows. (Each datum depicts averages of 6 movies over 300min time-windows centered at 150min, 450min, 750min, 1050min and 1350min.) In each case, as time increased, cells slowed down and the pack size decreased or stabilized. Across all cases, cells tended to migrate faster as they exhibited larger packs (by linear regression on data from all cell lines and time points, Speed = 0.006Pack size + 0.13, R2 = 0.7, p < 0.005). c. Persistence and cooperative pack sizes in migratory dynamics. In each case, as time increased the persistence decreased. Across all cases, migratory persistent and pack sizes roughly exhibited a positive relationship (by linear regression on data from all cell lines and time points, Persistence = 0.084Pack size + 2.12, R2 = 0.33, p < 0.005). Error bars represent the standard error of the mean.

