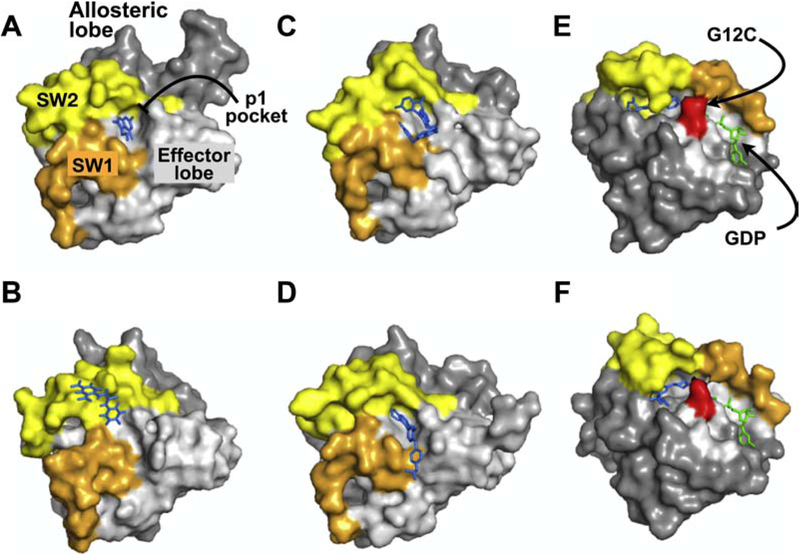
Figure 4. RAS Structures. X-ray crystral structures of RAS in complex with various inhibitors.
Panels A-D illustrate structures of different compounds that all target the p1 pocket in RAS whereas panels E & F represent covalent RAS inhibitors targeting KRAS(G12C). The effector lobe is shown in light gray, allosteric lobe in dark gray, SW1, orange, and SW2, light yellow. Inhibitors bound to RAS are shown in blue and nucleotide in green. A. KRAS(G12D):DCAI (PDB: 4DST). B. HRAS(T35S):Kobe2601 (PDB: 2LWI). C. KRAS(G12D):BI-2852 (PDB: 6GJ8). D. KRAS(Q61H):ABD7 (PDB: 6FA4). D. KRAS(G12C):ARS-1620 (PDB:5V9U). E. KRAS(G12D):compound 12 (PDB: 6N2K). Structures A-D are shown in the same orientation to highlight the p1 pocket. Structures E and F are shown in a different orientation to highlight the SII-P pocket and the Cys residue (shown in red) targeted by the indicated compounds.

