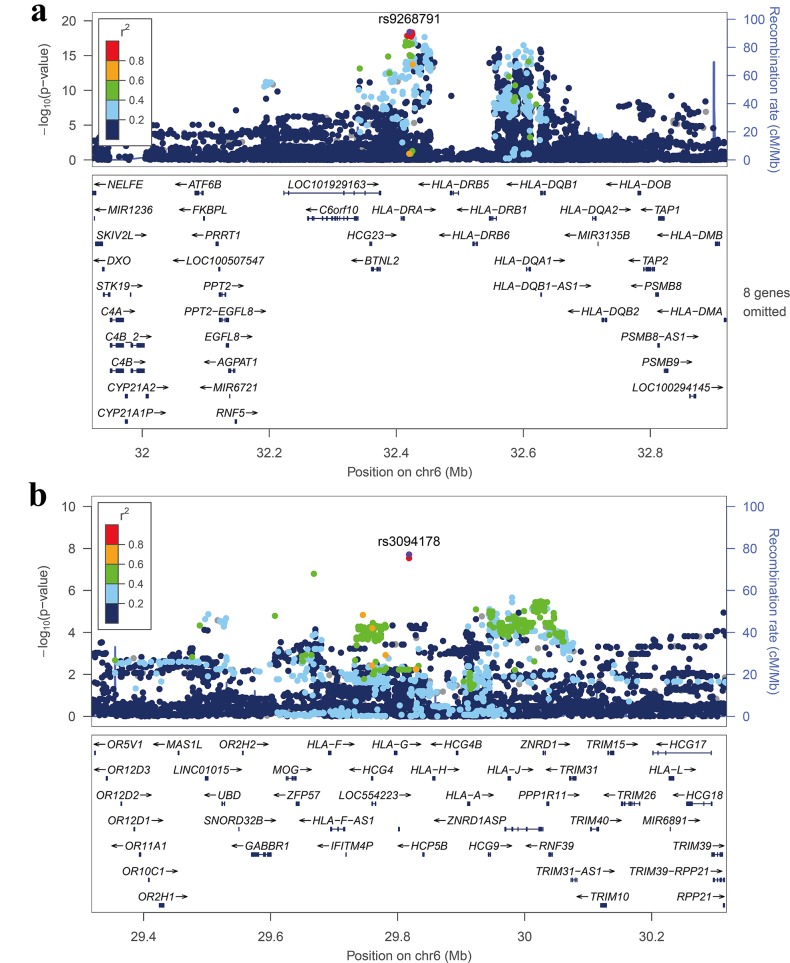
Figure 1.
Regional association plots of the adult-onset Still's disease-associated HLA class I and II regions. (A) HLA class II region and (B) HLA class I region. Purple circles represent the most significantly associated single nucleotide polymorphisms (SNPs) (marker SNPs) in each region in the meta-analysis of discovery and replication. −log10p values (Y-axis) of the SNPs (within the regions spanning 500 kb on either side of the marker SNP) are presented according to the chromosomal positions of the SNPs (X-axis, hg19). SNPs are coloured according to their linkage disequilibrium (LD) with the marker SNP. The LD values were established based on the 1000 Genomes Asian (ASI) Data (March 2012). Estimated recombination rates with samples from the 1000 Genomes Project March 2012 release are shown as blue lines, and the genomic locations of genes within the regions of interest annotated from the University of California, Santa Cruz (UCSC) genome browser are shown as arrows.

