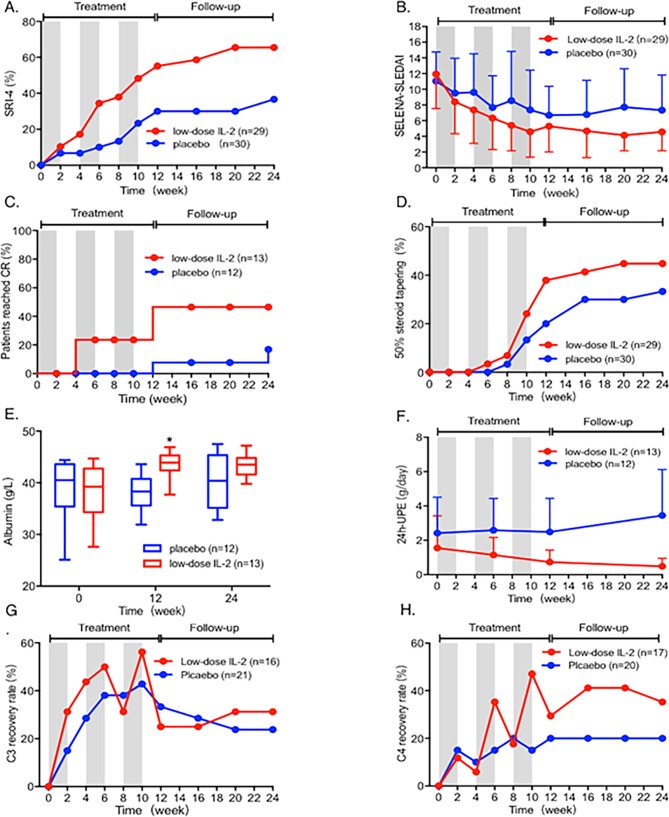
Figure 2.
Clinical response of SLE patients after treatment with low-dose IL-2 and placebo. (A) The SRI-4 response rate of patients receiving low-dose IL-2 (red) or placebo (blue) treatment during the 12-week treatment and 12-week follow-up period. Grey areas indicate the periods on IL-2 or placebo therapy. (B) SELENA-SLEDAI scores during the 24 weeks. (C) Complete remission (CR) rate in patients with lupus nephritis. (D) Proportion of patients achieving corticosteroid reduction by ≥50% from baseline to 24 weeks. (E) Levels of albumin at week 0, 12 and 24. (F) Proteinuria per 24 hours (24-UPE) of patients with lupus nephritis from baseline to 24 weeks. (G, H) The percentages of patients achieving normal levels of C3 and C4 in the 24 weeks. *p<0.05. The actual data of the results are listed in online supplementary table S13–20 (online supplementary table S13 for (A), online supplementary table S14 for (B), online supplementary table S15 for (C), online supplementary file 1 for (D), online supplementary table S17 for (E), online supplementary table S18 for (F), online supplementary table S19 for (G) and online supplementary file 1 for (H)). SRI-4, SLE Responder Index-4.

