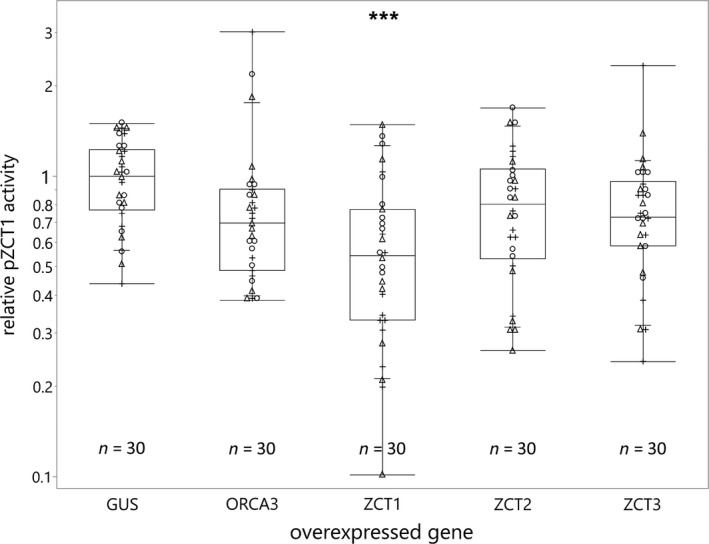
Figure 6.

ORCA3 does not activate the ZCT1 promoter, but ZCT1 represses its own promoter. Catharanthus roseus seedlings, at three days after transfer to light, were vacuum‐infiltrated with a combination of two strains of Agrobacterium tumefaciens (total OD600 = 0.4): (I) strain containing the ZCT1 promoter‐driven FLUC‐I reporter and the AtuNOS promoter‐driven RLUC‐I normalization reporter (plasmid pSB135; OD600 = 0.06), and II) strain containing a CaMV2x35s‐driven effector for transactivation (GUS as control—pSB161 (Addgene ID #123197), ORCA3—pSB160 (Addgene ID #123196), or ZCTs—pSB153‐155; OD600 = 0.34). Samples were taken three days postinfection. The ZCT1 promoter activity is the ratio of FLUC (firefly luciferase) to RLUC (Renilla luciferase) activity for each sample normalized to the ratio of FLUC to RLUC activity of the GUS control (set to 1). The experiment was carried out in three independent assays (represented by +, ○, and Δ symbols). Each data point represents luciferase activity of 2 seedlings. The horizontal line of the boxes shows the median, the ends of the boxes show the 1st and 3rd quantile, and whiskers show the lowest and highest data point values within the 1st and 3rd quartile. The data were log‐normal‐transformed to obtain normally distributed data. Data were analyzed using a one‐way ANOVA, and significant differences, compared to the GUS control, were determined using the Dunnett's method on log‐normal‐transformed data. p‐values < .001 are indicated with three stars (***)
