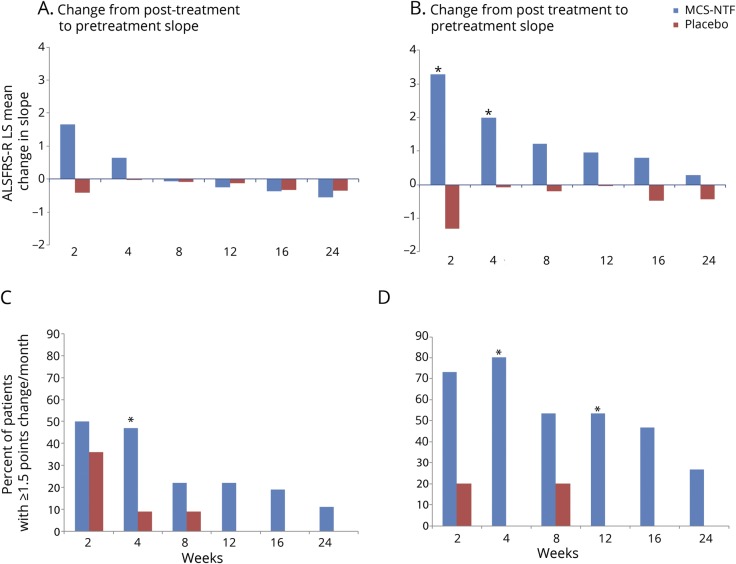
Figure 2. Mean change in Revised ALS Functional Rating Scale (ALSFRS-R) slope over time (top) and responder analyses: ≥1.5-point ALSFRS-R slope improvement over the post-treatment follow-up period (bottom).
(A, B) ALSFRS-R least squares (LS) means of the change in slope (post-treatment minus pretreatment) for each of the post-treatment time points for the total population (A) and rapid progressors (defined as those participants with a pretreatment ALSFRS-R change ≥−2 between screening and baseline) (B). The difference between the treated and placebo groups was statistically significant at the 2 and 4 weeks timepoints (p = 0.021 and 0.033, respectively, indicated by a * for p < 0.05). (C, D) The percentage of participants with a ≥1.5-point improvement in the ALSFRS-R slope at the indicated time points as compared to their pretreatment slope over the ∼12 weeks pretreatment period in the mesenchymal stem cell (MSC)–neurotrophic factor (NTF) cells treated and the placebo group total population (C) and rapid progressors (defined as participants with a pretreatment ALSFRS-R change ≥−2 between screening and baseline) (D). In the overall population, the difference was statistically significant at week 4 (p = 0.033). In rapid progressors, the differences between the treated and placebo groups were statistically significant at the 4 and 12 weeks timepoints (p = 0.004 and 0.046, respectively, indicated by a * for p < 0.05).

