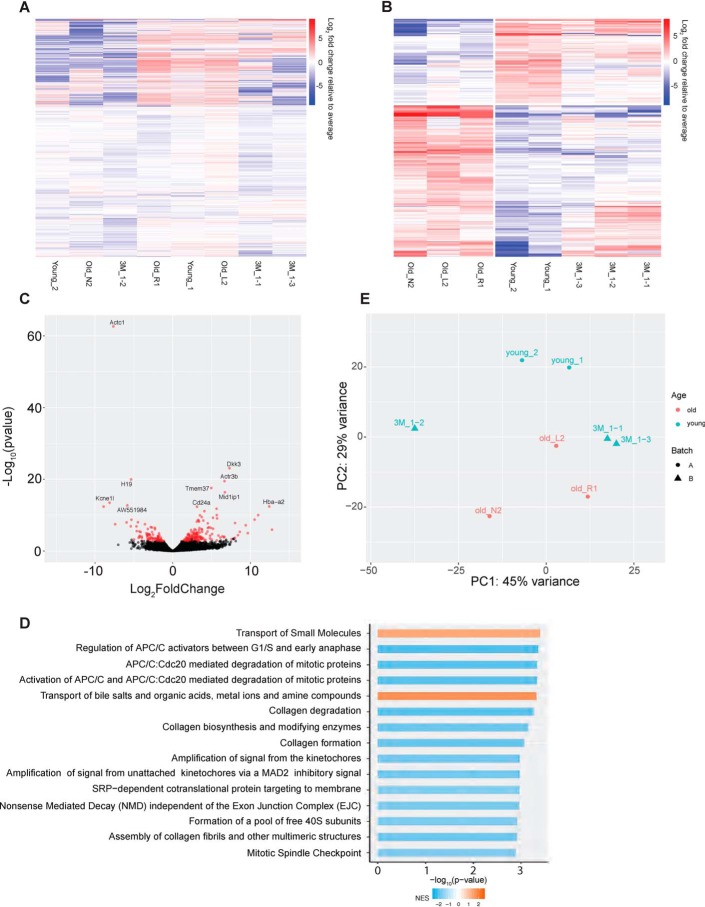
Figure 5.
Comparative analysis of whole transcriptome between single myofibers from young and old mice. A, heat map of all genes expressed in old and young myofibers. B, heat map of differentially expressed genes between the old and young myofibers. Colors indicate Log2 fold change relative to average per gene, with red indicating a higher expression and blue as a lower expression between young (1 and 3 months) and old (19 months) myofibers. C, volcano plot of the differentially expressed genes between young and old myofibers. Points in red indicate there is a significant difference between the two groups. D, GO term analysis of the top 15 differentially regulated pathways. E, projection of samples along first two principal components found by PCA applied to log reads-per-million gene expression of young (1 and 3 months) and old (19 months) myofibers.

