Figure 1.
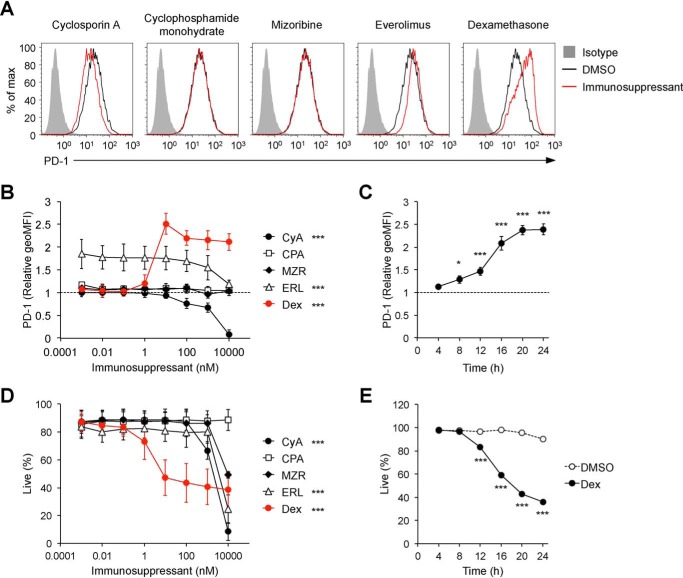
Effects of immunosuppressants on PD-1 expression. A, surface PD-1 expression levels on DO11.10 T hybridoma cells after treatment with immunosuppressants. Representative histogram plots are shown for cells treated with the indicated immunosuppressants (100 nm). Gray-shaded histograms represent isotype control Ig staining. B–E, dose- and time-dependent effects of immunosuppressants on PD-1 expression (B and C) and cell viability (D and E). DO11.10 T hybridoma cells were cultured in the presence of the indicated immunosuppressants at the indicated doses (B and D) for 24 h or dexamethasone (100 nm, C and E) for the indicated hours and analyzed by flow cytometry. -Fold changes in PD-1 expression relative to DMSO-treated cells (the relative geometric mean fluorescence intensity (geoMFI) of PD-1, B and C) and the percentages of live (propidium iodide (PI)–negative) cells are shown (D and E). Representative plots of three independent experiments (A) or the mean ± S.D. of three independent experiments (B–E) are shown. Two-way ANOVA with Dunnett's multiple comparisons test (compared with DMSO-treated cells, B and D) or with Bonferroni's multiple comparisons test (compared with DMSO-treated cells, E) and one-way ANOVA with Dunnett's multiple comparisons test (compared with before treatment, C) were used. *, p < 0.05; ***, p < 0.001. CyA, cyclosporin A; CPA, cyclophosphamide monohydrate; MZR, mizoribine; ERL, everolimus; Dex, dexamethasone.

