Figure 4.
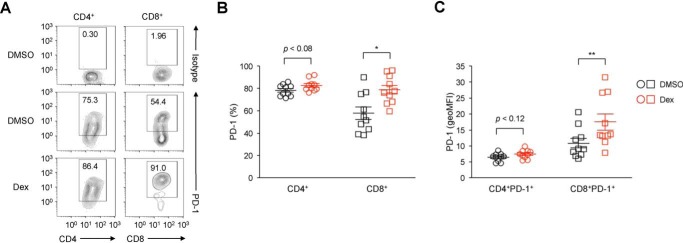
Up-regulation of PD-1 on tumor-infiltrating CD8+ T cells by GCs. A–C, surface PD-1 expression levels on T cells infiltrating tumors of CT26 colon carcinoma cells. BALB/c mice were subcutaneously administered DMSO or dexamethasone (400 μg) 10 and 12 days after subcutaneous inoculation of CT26 cells. On day 13, the percentages of tumor-infiltrating CD4+ and CD8+ T cells expressing PD-1 (gated on PI−CD45+CD4+ and PI−CD45+ CD8+, respectively; A and B) and the expression levels of PD-1 on PD-1–expressing CD4+ and CD8+ T cells (geoMFI, C) were analyzed by flow cytometry. Representative histogram plots of three independent experiments are shown (A). Each symbol represents an individual mouse (n = 10 each), and horizontal lines denote the mean ± S.E. of 10 biological replicates pooled from three independent experiments. Two-tailed Student's t test. *, p < 0.05; **, p < 0.01.

