Figure 5.

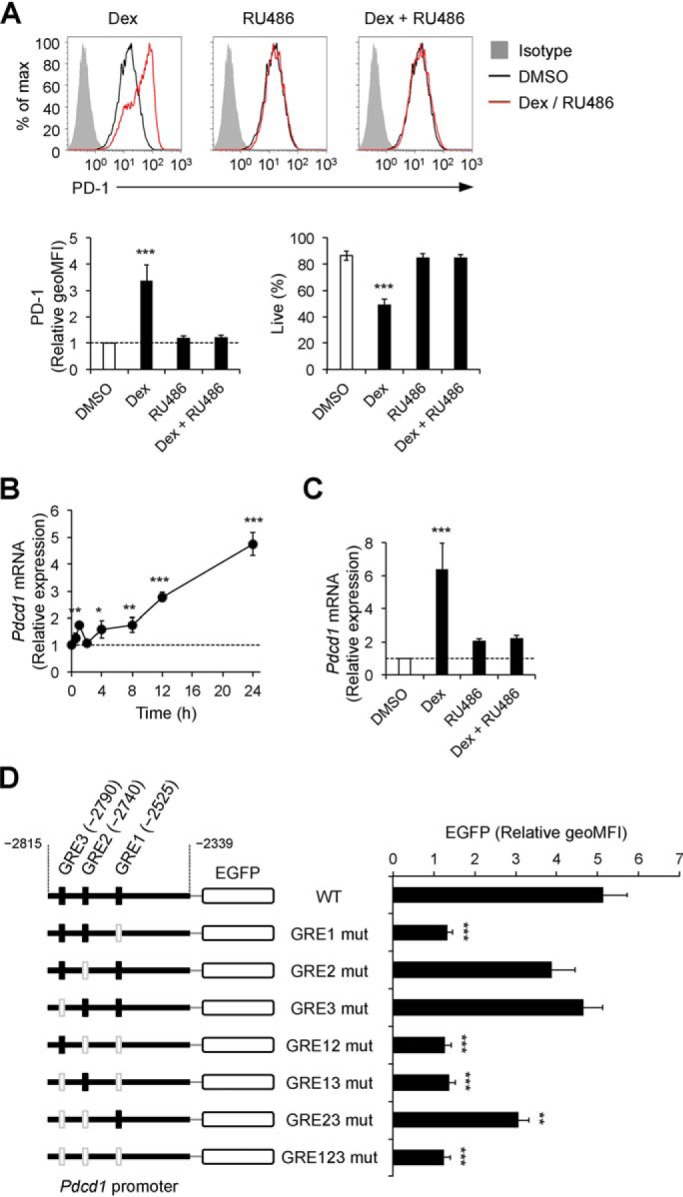
GR-dependent augmentation of PD-1 transcription by GC treatment. A, abrogation of GC-mediated PD-1 up-regulation and cell death by the glucocorticoid receptor antagonist RU486. DO11.10 T hybridoma cells were cultured in the presence of dexamethasone (100 nm) and RU486 (10 μm) for 24 h and analyzed by flow cytometry. -Fold changes in PD-1 expression relative to DMSO-treated cells and the percentages of live cells are shown. Gray-shaded histograms represent isotype control Ig staining. B, the time course of PD-1 mRNA expression in DO11.10 T hybridoma cells after treatment with dexamethasone. Expression levels of PD-1 mRNA were determined by real-time quantitative PCR and normalized to those of GAPDH mRNA. -Fold changes relative to DMSO-treated cells are shown. C, abrogation of GC-mediated PD-1 mRNA up-regulation by RU486. DO11.10 T hybridoma cells were cultured in the presence of dexamethasone (100 nm) and RU486 (10 μm) for 24 h, and -fold changes of PD-1 mRNA expression relative to DMSO-treated cells were determined as in B. D, promoter activity of DNA sequences containing three putative GREs in the promoter region of the PD-1 gene upon GC treatment. Shown are schematics of reporter constructs encoding EGFP cDNA and the promoter region of the PD-1 gene (2790–2339 bp upstream of the transcription start site) with or without nucleotide mutations in the putative GREs (left). DO11.10 T hybridoma cells transduced with mouse GR and the indicated reporter constructs were cultured in the presence of dexamethasone (100 nm), phorbol 12-myristate 13-acetate (50 ng/ml), and ionomycin (500 ng/ml) for 24 h and analyzed by flow cytometry. Relative geoMFIs of EGFP compared with DMSO-treated cells are shown. The mean ± S.D. (A and C) or S.E. (D) of three independent experiments or the mean ± S.D. of technical triplicates of one of three independent experiments (B) are shown. One-way ANOVA with Dunnett's multiple comparisons test compared with DMSO-treated cells (A–C) or cells with the WT reporter construct (D) was used. *, p < 0.05; **, p < 0.01; ***, p < 0.001.
