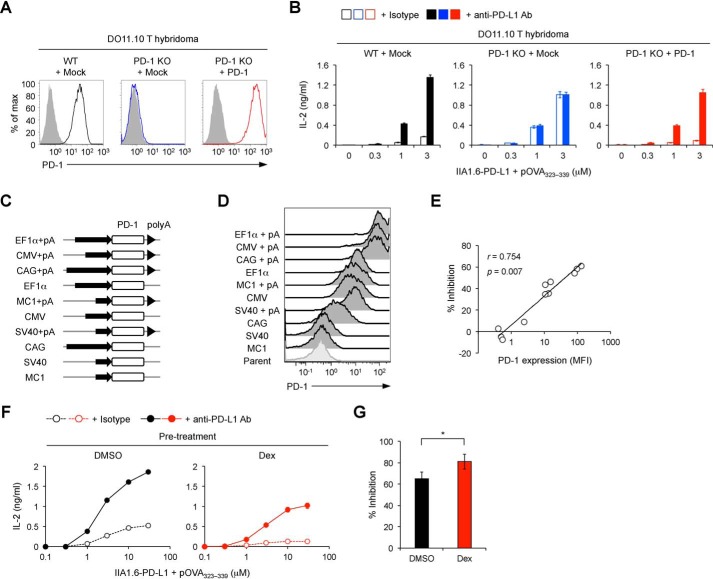
Figure 6.
Potentiation of the inhibitory effect of PD-1 by GCs. A, surface PD-1 expression levels on DO11.10 T hybridoma cells with or without deletion and overexpression of PD-1. B, restoration of PD-1–mediated inhibitory effects by overexpression of PD-1 in DO11.10 T hybridoma cells with targeted deletion of the PD-1 gene. IL-2 concentration in the culture supernatant is shown for the indicated DO11.10 T hybridoma cells stimulated with pOVA323–339–pulsed IIA1.6–PD-L1 cells in the presence or absence of anti-PD-L1–blocking Ab for 24 h. C, schematics of retroviral expression vectors. Mouse PD-1 cDNA was overexpressed in DO11.10 T hybridoma cells with targeted deletion of the PD-1 gene using the indicated promoters with or without a poly(A) signal (pA). D, flow cytometric analysis of DO11.10 T hybridoma cells overexpressing PD-1 at various levels by using the retroviral expression vectors shown in C. E, the correlation between the percent inhibition of IL-2 production by PD-1 and the expression level of PD-1 (MFI). DO11.10 T hybridoma cells with different PD-1 expression levels were stimulated as in B. F and G, augmentation of PD-1–mediated inhibitory effects by dexamethasone. DO11.10 T hybridoma cells were treated with dexamethasone (100 nm) or DMSO for 24 h and rested for 6 h. The same numbers of dexamethasone- or DMSO-treated live cells were stimulated for 24 h as in B. IL-2 concentration in the culture supernatant (F) and percent inhibition of IL-2 production by PD-1 (G) are shown. Data are the mean ± S.D. of technical duplicates of one representative experiment (B and F) or the mean ± S.D. of four independent experiments (G). Data are representative of at least three independent experiments (A, B, and D–F). Two-tailed Student's t test (G) was used. CMV, cytomegalovirus; CAG, cytomegalovirus enhancer/chicken β-actin. *, p < 0.05.

