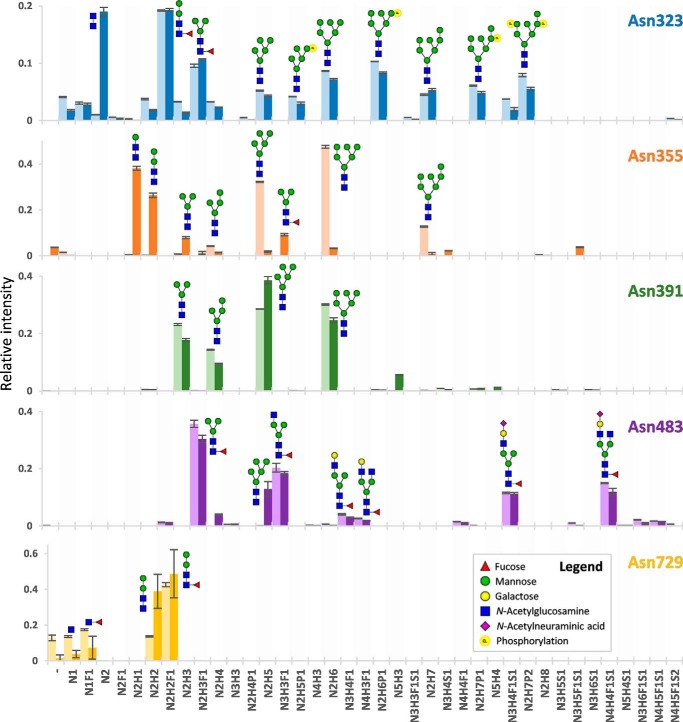
Figure 6.
Qualitative and quantitative overview of the glycan distribution per MPO N-glycosylation site. Each colored bar represents one N-glycosylation site, the lighter and darker variant, respectively, the biologically independent discovery pool and replication pool. The height of the bars indicates the mean relative area of MS1 signals from a triplicate LC-MS2 run (the MS2 differing in fragmentation scheme) and the error bars the S.D. thereof. Informative fragment spectra were acquired for all shown compositions, reporting on the glycan composition, antenna composition, fucose location, and the location of the phosphate. Antenna- and linkage-isomerism were not established by the study, and the here-presented compositions are proposed on basis of the literature on glycan biosynthesis (24, 25) but may also have been formed by glycosidase action. H = hexose, n = N-acetylhexosamine, F = deoxyhexose (fucose), S = N-acetylneuraminic acid, p = phosphorylation.

