Figure 5.
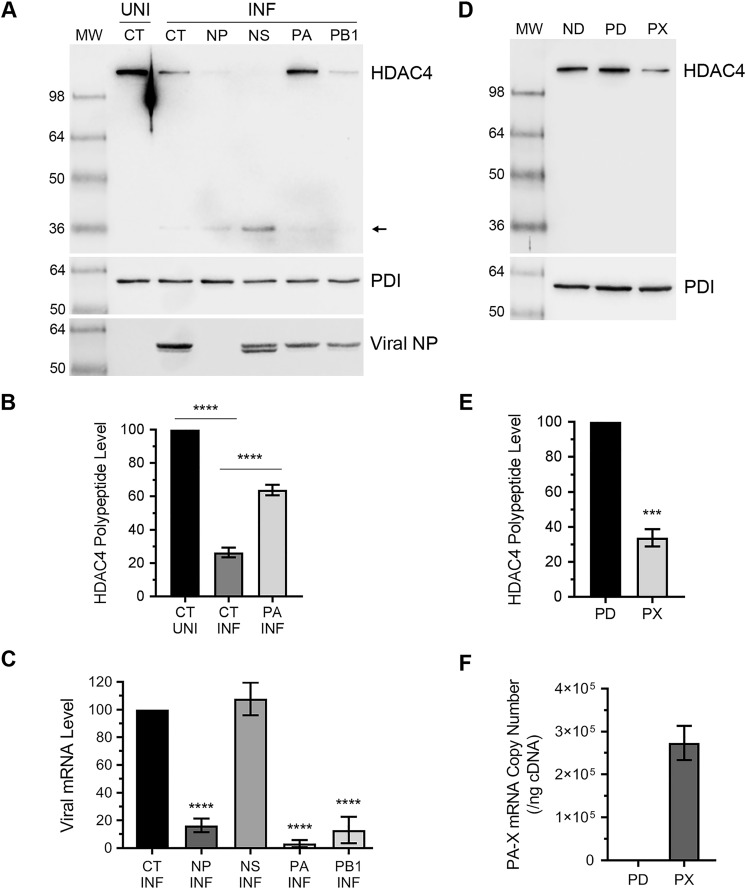
The IAV protein PA-X is involved in down-regulation of HDAC4 polypeptide. A–C, A549 cells were transfected in duplicate with 50 nm control siRNA (CT) or viral NP, NS, PA, or PB1 siRNA for 24 h. Cells were then infected with PR8 at a m.o.i. of 1.0 for further 24 h. A, one set of cells was harvested and the HDAC4, PDI, and NP polypeptides were detected in total uninfected (UNI) and infected (INF) cell lysates by Western blotting. Note: the HDAC4 blot was reused to probe for PDI and NP. B, the full-length HDAC4 polypeptide levels in UNI/CT, INF/CT, and INF/PA lanes of panel A were quantified and normalized as described in the legend to Fig. 1B. Then, the normalized level of the HDAC4 polypeptide in uninfected/control siRNA-transfected (UNI/CT) cells was considered 100% to compare its levels in infected/control siRNA-transfected (INF/CT) cells and the PA siRNA-transfected/infected (INF/PA) cells. C, the second set of cells was processed to detect the levels of NP, NS, PA, PB1, and actin mRNAs by qPCR. Then, the levels of viral gene mRNAs in control siRNA-transfected and viral gene siRNA-transfected cells were normalized with corresponding actin mRNA levels. Finally, the normalized levels of viral mRNAs in control siRNA-transfected cells were considered 100% to compare their levels in viral gene siRNA-transfected cells. D–F, A549 cells were transfected in duplicate with no DNA (ND), empty plasmid pcDNA3 (PD), or PA-X plasmid (PX) for 48 h. D, one set of cells were harvested and the HDAC4 and PDI polypeptides were detected in total cell lysates by Western blotting. Note: the HDAC4 blot was reused to probe for PDI. E, the full-length HDAC4 polypeptide level in panel D was quantified and normalized as described in the legend to Fig. 1B. Then, the normalized level of HDAC4 polypeptide in pcDNA3-transfected cells (PD) was considered 100% to compare its level in the PA-X plasmid-transfected cells (PX). F, the second set of cells was processed to determine the PA-X mRNA copy number by absolute qPCR using the PA-X plasmid as a calibrator. For this, PA-X cDNA from PA-X plasmid-transfected cells and 10-fold serial dilutions of PA-X plasmid was amplified by qPCR. In parallel, the number of PA-X cDNA copies in 10-fold serial dilutions were calculated using the known plasmid DNA concentration and plasmid molecular weight. Then, a standard curve of cycle threshold (CT) value from qPCR versus cDNA copy numbers was generated and was used as a reference to calculate the PA-X mRNA copy numbers in PA-X plasmid-transfected cells. Error bars represent the mean ± S.E. of three independent experiments. The asterisks represent p values mentioned in the text calculated by ANOVA (B and C) or unpaired t test (E), and indicate the significant differences in means. MW, molecular weight.

