Figure 5.
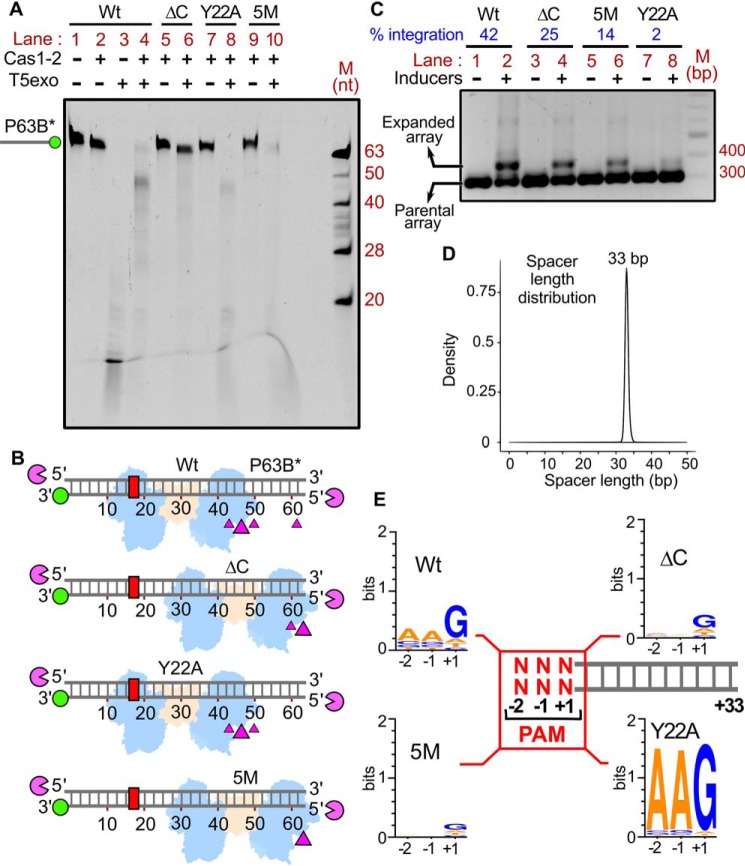
Intrinsic specificity of Cas1-2 integrase directs the uniformity in spacer length and PAM preference during CRISPR adaptation. A, denaturing PAGE depicting the T5exo treatment of Cas1-2 (WT (lanes 1–4), ΔC (lanes 5 and 6), Y22A (lanes 7 and 8), or 5M (lanes 9 and 10))-bound fluorescein-labeled P63B* is displayed. The presence (+) or absence (−) of each reaction component is indicated at the top of each lane. The position of P63B*-labeled DNA fragment is shown on the left, whereas oligonucleotide marker (M) positions are indicated on the right. B, schematic illustration of the footprinting assay performed in A. DNA substrate P63B* (gray ladder), positions of 3′-fluorescein label (green circle), and PAM region (red rectangle) are represented. Numbering on the DNA represents the distance (in nt) of a particular position from the labeled end. T5 exo (magenta pie) is positioned at susceptible 5′-ends of DNA substrate. Positions of T5exo stalling points (magenta triangles) and binding sites of each variant of Cas1-2 (WT, ΔC, Y22A, or 5M in blue and brown blobs) that are estimated from the nuclease footprinting assay performed in A are displayed. C, agarose gel depicting the PCR products from the spacer acquisition assay performed in E. coli harboring the plasmids that express the Cas1-2 variants (WT (lanes 1 and 2), ΔC (lanes 3 and 4), 5M (lanes 5 and 6), and Y22A (lanes 7 and 8)). The absence (−) or presence (+) of inducers is indicated at the top of each lane. Positions corresponding to parental and expanded arrays (CRISPR 2.1 array) are indicated on the left. The percentage of integration is displayed at the top of the respective lanes (indicated in blue). DNA marker (M) positions are represented on the right. D, overlay of plots depicting length distribution of the newly acquired spacers that are incorporated into CRISPR 2.1 array by Cas1-2 variants (WT, ΔC, 5M, and Y22A) during the in vivo integration assay (C). The x axis depicts the length of the spacer (nt), whereas normalized frequency (density) is indicated on the y axis. E, illustration depicting the PAM preference of Cas1-2 variants (WT, ΔC, 5M, and Y22A) during the in vivo integration assay (C). +1 to +33 sequence of each spacer (gray ladder) was extracted from high-throughput sequencing data. Subsequently, sequence information of −1 and −2 positions of each spacer was derived from the respective plasmid/genome sequence. The conservation profile of PAM sequences (−2, −1, and +1 in red) corresponding to the respective Cas1-2 variant is shown as a sequence logo.

