Figure 6.

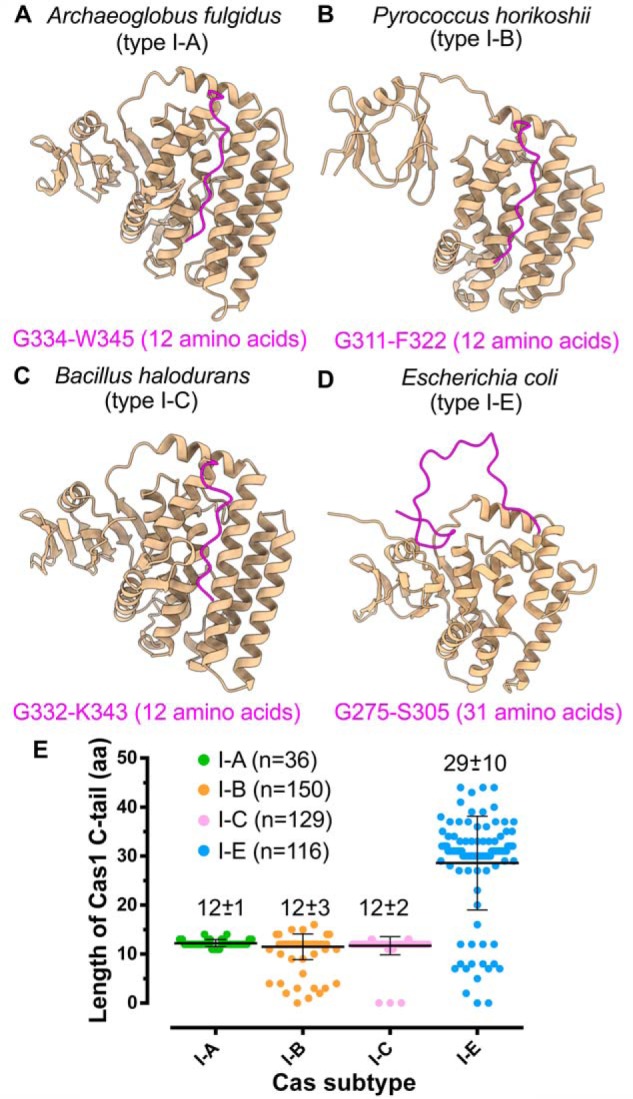
Cas1/I-E harbors extended C-terminal tail. A–D, structures highlighting Cas1 C-terminal tail (in magenta) of A. fulgidus (type I-A; PDB code 4N06) (A), P. horikoshii (type I-B; PDB code 4WJ0) (B), B. halodurans (type I-C; predicted model) (C), and E. coli (type I-E; PDB code 5DQZ) (D). The amino acids corresponding to the start and end positions of the C-terminal tail are displayed at the bottom of the respective structures. E, scatter plot representing the length differences among Cas1 of type I-A, I-B, I-C, and I-E. Each Cas subtype is shown in a different color, and the average length of amino acids in the C-terminal tail (mean ± S.D. (error bars)) of each subtype is indicated at the respective position. n corresponds to the number of Cas1 sequences from each subtype that are considered for the analysis (see “Experimental procedures”).
