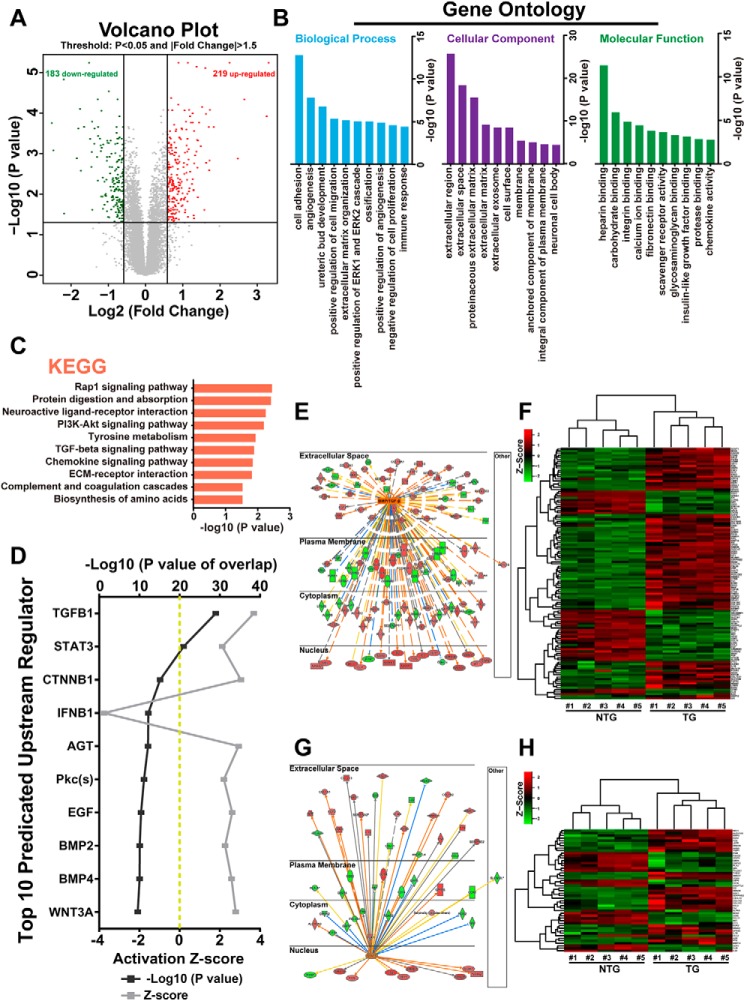
Figure 4.
In silico analysis of altered signaling pathways in BMP10 transgenic hearts. A, volcano plots of gene expression profiles using a previously published gene array data set comparing 4-week-old TG hearts versus NTG hearts. B, functional categorization of all differentially expressed genes based on Gene Ontology annotations. C, pathway analysis of all differentially expressed genes by the Kyoto Encyclopedia of Genes and Genomes (KEGG). D, top 10 upstream regulators predicted by IPA. The predicted regulators were sorted by overlapping p value, predicted activation state, and activation Z score. E, regulatory network of the BMP/TGFβ signaling pathway in TG hearts. The color intensity of the nodes indicates the expression level of the genes, with red representing up-regulation and green representing down-regulation. Connecting lines show the predicted relationships to BMP/TGFβ signaling, with orange representing predicted activation, blue representing inhibition, yellow representing inconsistency, and gray representing “to be determined.” The direct interaction is represented as a solid line, whereas indirect interaction is indicated by a dotted line. F, heat map of BMP/TGFβ regulated differentially expressed genes in TG versus NTG hearts. G, regulatory network of STAT3 signal pathway in TG hearts. H, heat map of STAT3-regulated differentially expressed genes in TG versus NTG hearts. ECM, extracellular matrix; PI3K, phosphatidylinositol 3-kinase.

