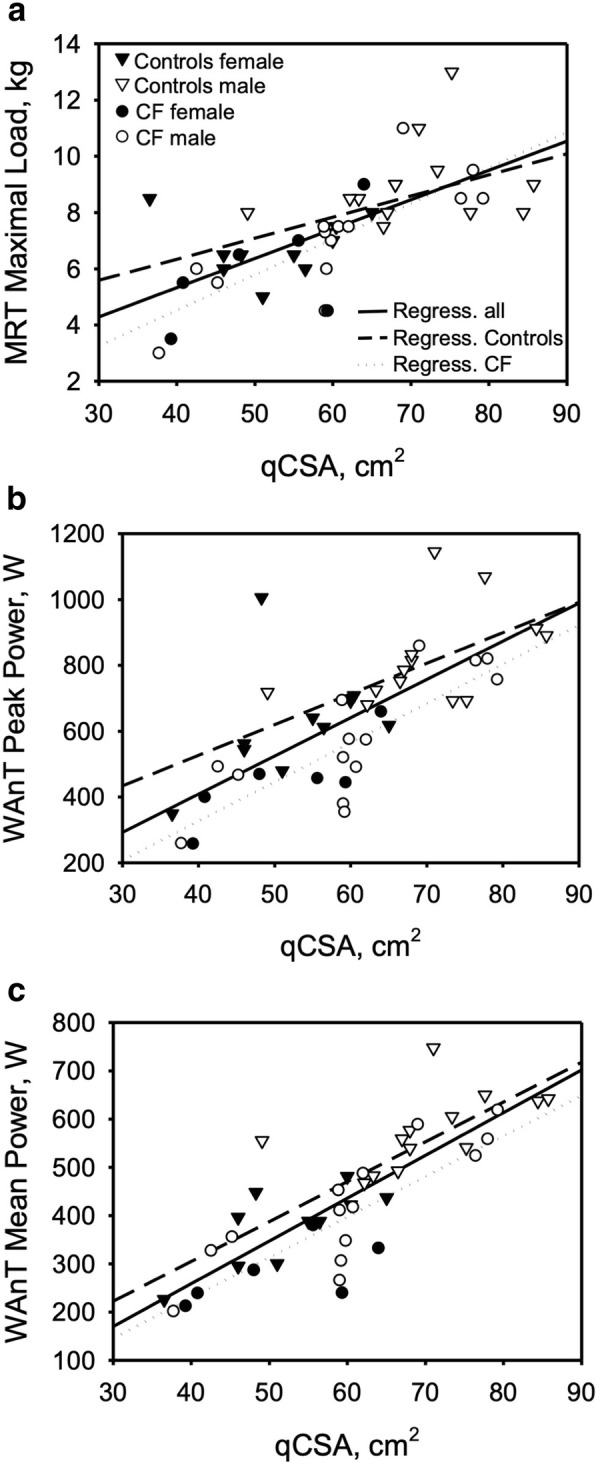
Fig. 2.

correlations between muscle cross sectional area (qCSA) and results of the MRI maximal workload (LastmaxMRT) and the Wingate anaerobic test. Regression lines are for the total cohort and separate for CF and CON (see legend of a). a correlation between qCSA and LastmaxMRT. b correlation between qCSA and peak power. c correlation between qCSA and mean power
