
Fig. 5.
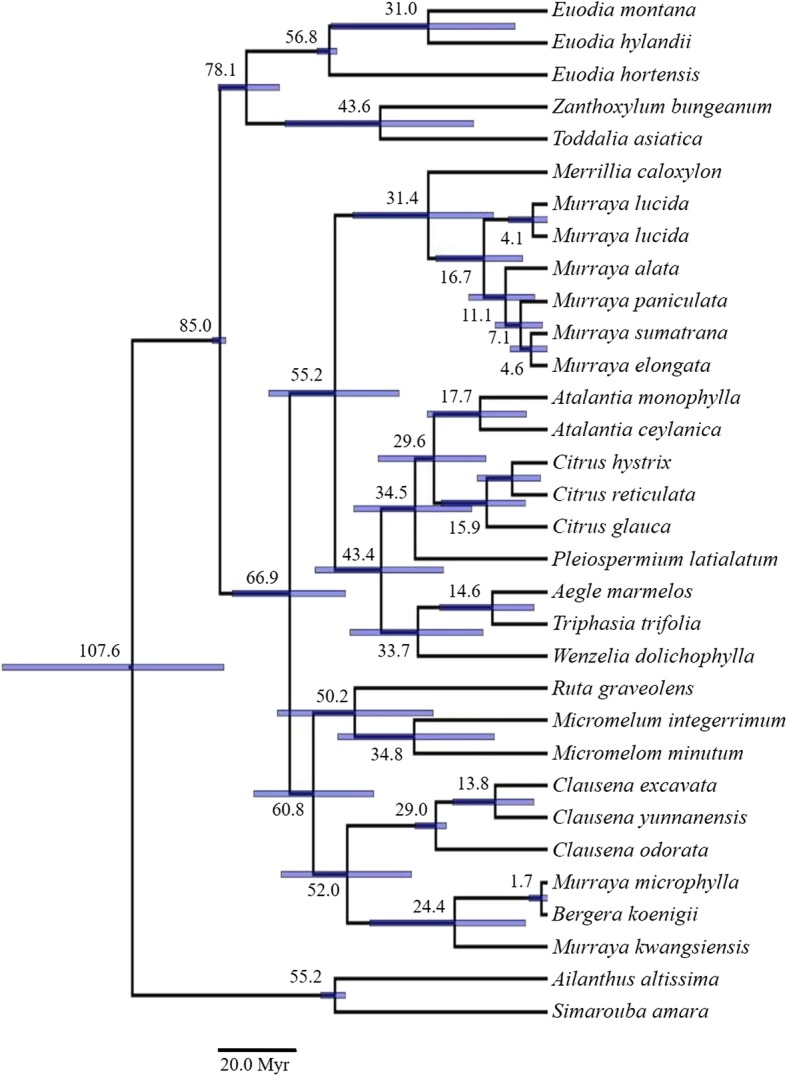
Maximum clade credibility tree produced using the BEAST suite of programs based on ITS regions. The values next to the nodes are the ages (Ma). The bars are the 95% highest posterior density
Official websites use .gov
A
.gov website belongs to an official
government organization in the United States.
Secure .gov websites use HTTPS
A lock (
) or https:// means you've safely
connected to the .gov website. Share sensitive
information only on official, secure websites.
Maximum clade credibility tree produced using the BEAST suite of programs based on ITS regions. The values next to the nodes are the ages (Ma). The bars are the 95% highest posterior density