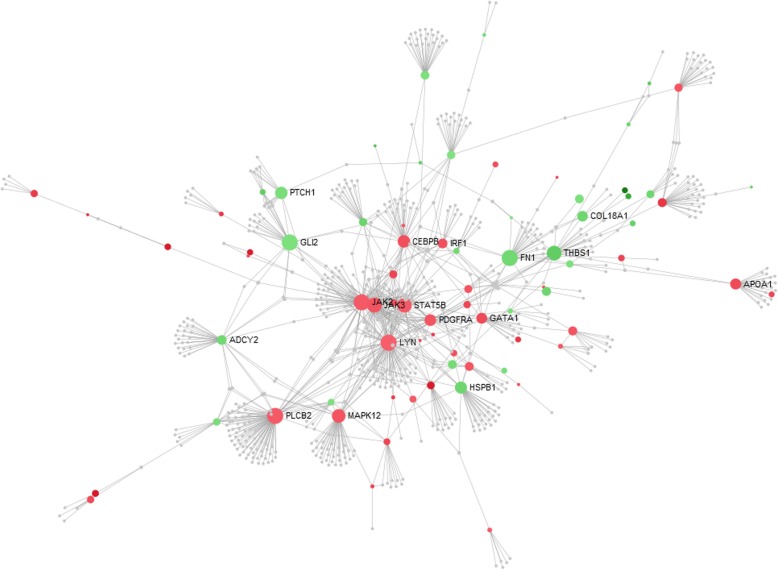
Fig. 6.
Gene enrichment analysis of differentially expressed genes and biological processes related to femoral head separation in broilers using the NetworkAnalyst tool. Nodes indicate the number of predicted gene interactions. Strong and large circles contain high number of genes. Red circles are the upregulated and green circles are the downregulated DE genes in FHS-affected compared to normal broilers

