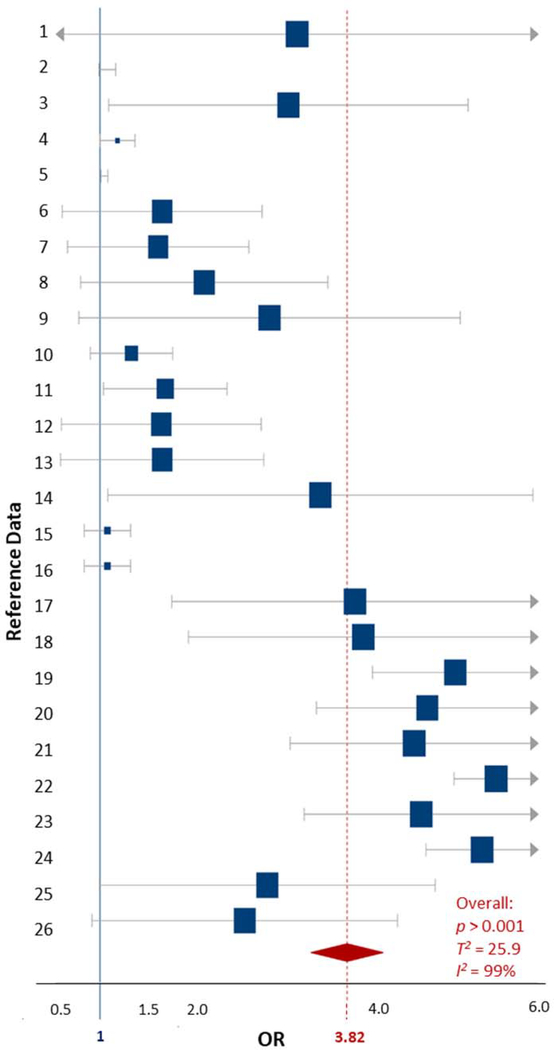
Figure 2.
Forest plot showing the ADHD-specific random effects meta-analysis for childhood exposures to Pb based on concentration data. The blue squares represent the mean OR from each reference datum (Table S1), the size variation represents the weight each datum had in the meta-analysis with larger sized indicating greater weights. The horizontal bars are the upper and lower CI95%. The red diamond is the summary OR based on the meta-analysis, with the mean indicated by a red dashed line. The ‘line of no effect’ at an OR of 1 is indicated with a solid blue line. Plot was made using the DistillerSR software (Evidence Partners).

