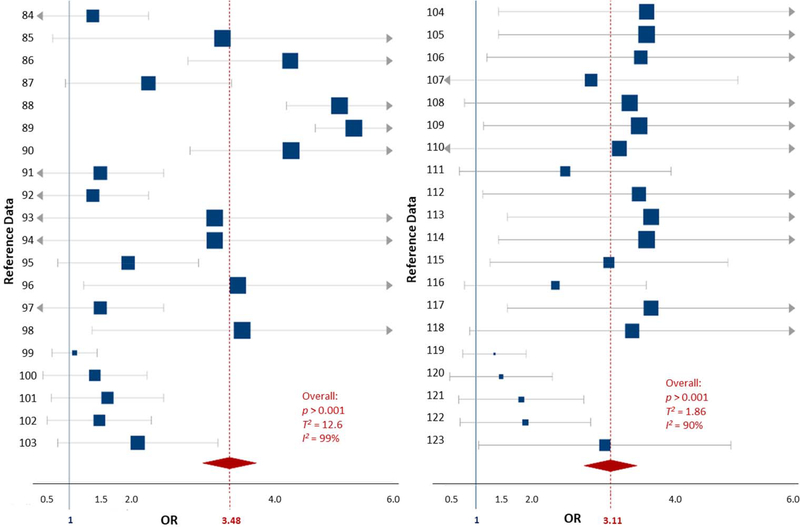
Figure 3.
Forest plots showing the random effects meta-analysis of exposures to phthalate/plasticizers and ADHD outcomes for both male and female children. Plots are separated by sex: males (left) and females (right). The blue squares represent the mean OR from each reference datum (Table S2), the size variation represents the weight each datum had in the meta-analysis with larger sized indicating greater weights. The horizontal bars are the upper and lower CI95%. The red diamond is the summary OR based on the meta-analysis, with the mean indicated by a red dashed line. The ‘line of no effect’ at an OR of 1 is indicated with a solid blue line. Plot was made using the DistillerSR software (Evidence Partners).

