
Fig. 2.
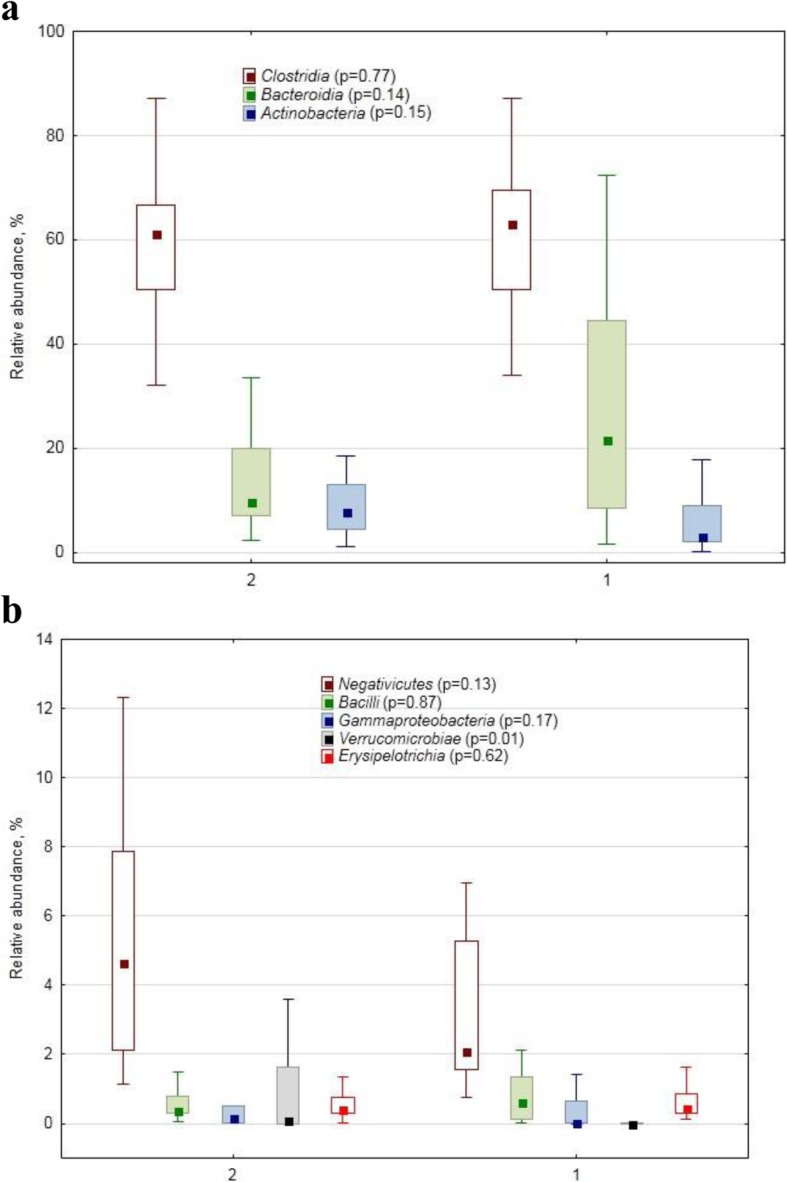
Relative abundance (%) of dominant (a) and minor/rare (b) class–specific 16S rRNA gene amplicon sequences in human faecal samples collected from healthy subjects (1) and from patients with primary progressive multiple sclerosis (2). The marker shows a median; the box shows the 75–25% quartile range, while the lines indicate the fluctuation range The p-values of the Mann-Whitney test for the conhorts’ comparison are shown in brackets after the class name