Fig. 4.
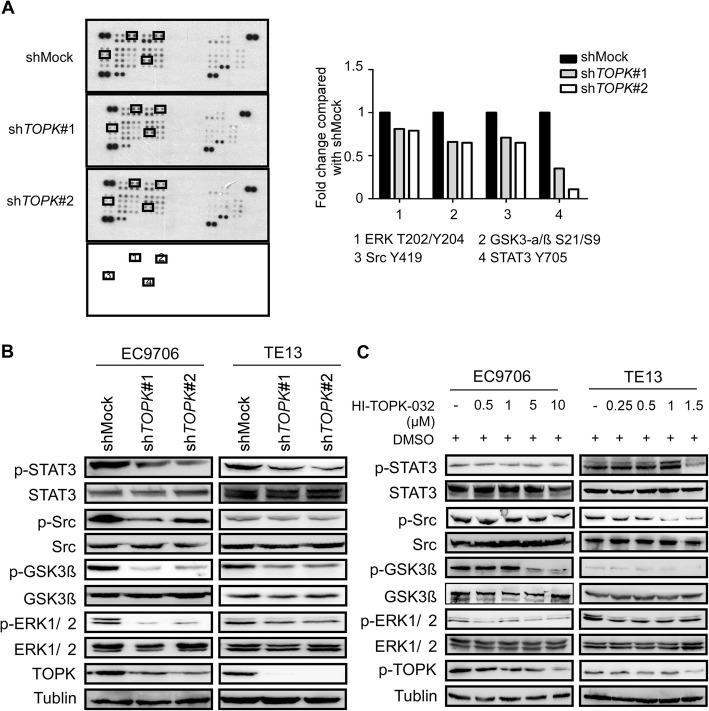
Src/GSK3β/STAT3 and ERK signaling pathways are strongly inhibited by knocking down TOPK and by treatment with HI-TOPK-032. a) The shMock-, shTOPK#1- and shTOPK#2-transfected cells were harvested and the TOPK level was determined by western blotting. Protein extracts (500 μg) were used for phospho-MAPK array analysis. The array spots were visualized using an enhanced chemiluminescence (ECL) kit (Fig a left). The density of each duplicated array spot (Fig a right) was measured as described in Materials and Methods. The graph showing the fold change in phosphorylation levels of Src, GSK3β, STAT3, and ERK normalized to the levels in the shMock-transfected cells (value of 1). The data are shown as the average of duplicate samples. b) The cell lysates (30 μg) from shMock0, shTOPK#1-, and shTOPK#2-transfected KYSE510 and KYSE30 cells were subjected to sodium dodecyl sulfate-polyacrylamide gel electrophoresis (SDS-PAGE) using 10% gel. The protein bands were visualized using a chemiluminescence detection kit after hybridization with horseradish peroxidase–conjugated secondary antibody. c) Western blot analysis of total and phosphorylated Src, GSK3β, STAT3, ERK and TOPK levels in the KYSE510 and KYSE30 cells, which were treated with different concentrations of HI-TOPK-032 for 24 h

