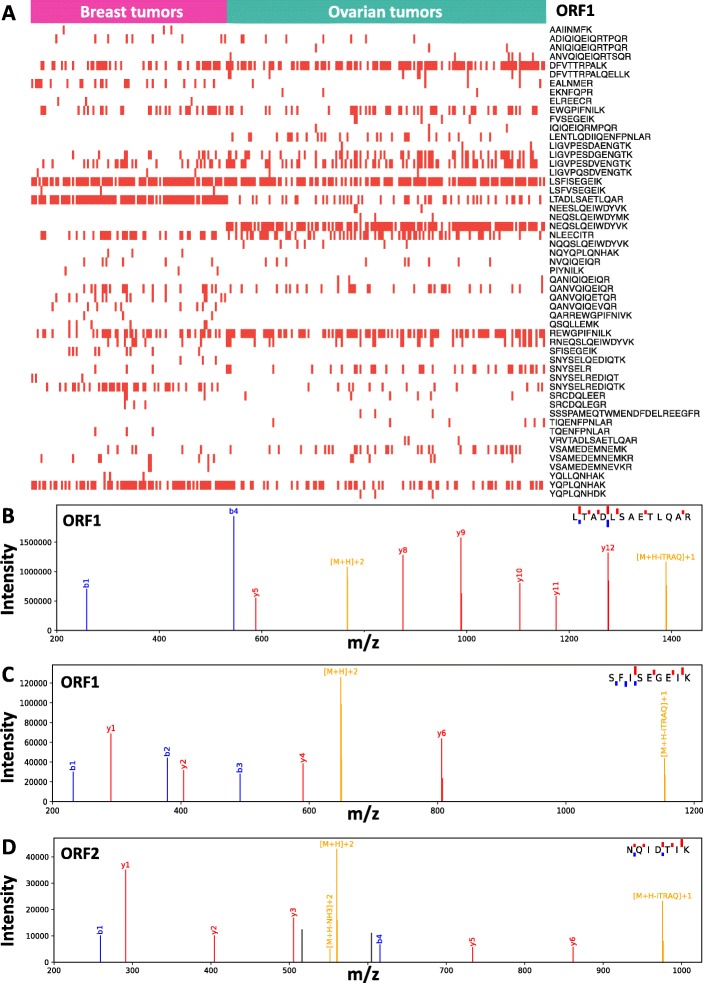
Fig. 1.
LINE-1 Peptide Detection in Tumor Mass Spectrometry Data. (a) ORF1p peptides observed in CPTAC breast and ovarian tumors. Each column represents a tumor-derived MS dataset (102 fuchsia-colored columns for breast tumors and 176 sea foam-colored columns for ovarian tumors) analyzed for the presence of L1 ORF peptides. ORF1 peptides, displayed at the right, mark rows. A red tick indicates that the given peptide was detected as present in the according tumor sample (white space: peptide not detected). Highest quality PSMs that were observed for (b, c) ORF1p and (d) ORF2p are displayed. Precursor ion related peaks are shown in yellow, y-ions in red, b-ions in blue, and unassigned ions in black

