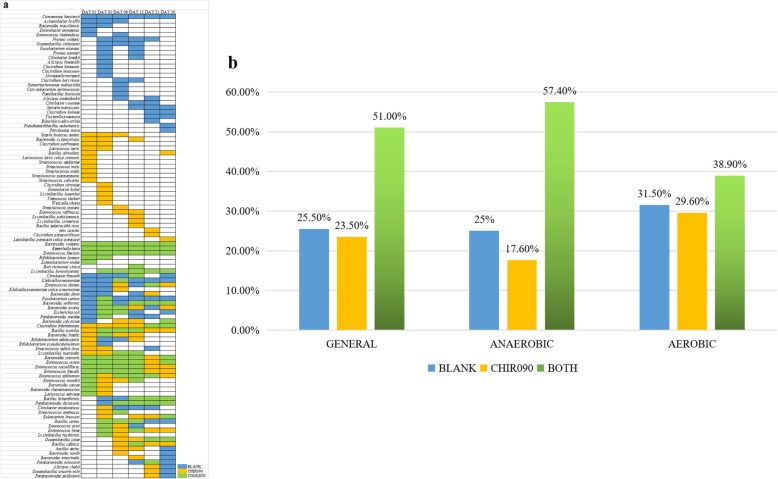
Fig. 3.
Distribution and percentages of bacteria in each group. a The distribution of 102 bacteria in different groups at 6 points in time under general condition. b The percentage of all bacteria identified in blank bottles and CHIR-090 bottles under general, anaerobic, and aerobic conditions. Blue represents the blank group, yellow represents the CHIR-090 group, and green indicates presence in both bottles (common group)

