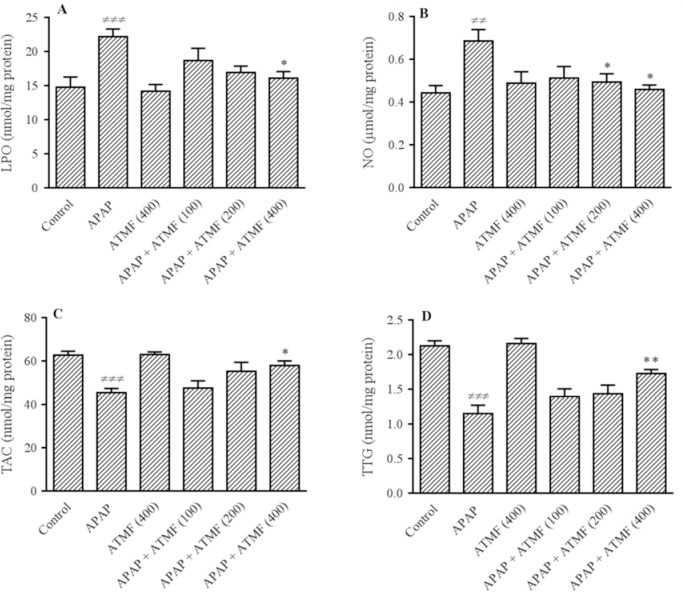
Fig. 2.
Effects of ATMF (100, 200, 400 mg/kg) on hepatic oxidative stress biomarkers (A-D) LPO, NO, TAC, and TTG, respectively, in APAP-exposed Wistar rats. Values are expressed as means ± SEM, n=6 for each group. ≠≠P < 0.01 and ≠≠≠P < 0.001 indicate significant differences vs control group; *P < 0.05 and **P < 0.01 indicate significant differences compared to APAP group. LPO, lipid peroxidation; NO, nitric oxide; TAC, total antioxidant capacity; TTG, total thiol groups; APAP, acetaminophen (equal 2 g/kg); ATMF, Allium tripedale methanol fraction.

