Fig. 1.

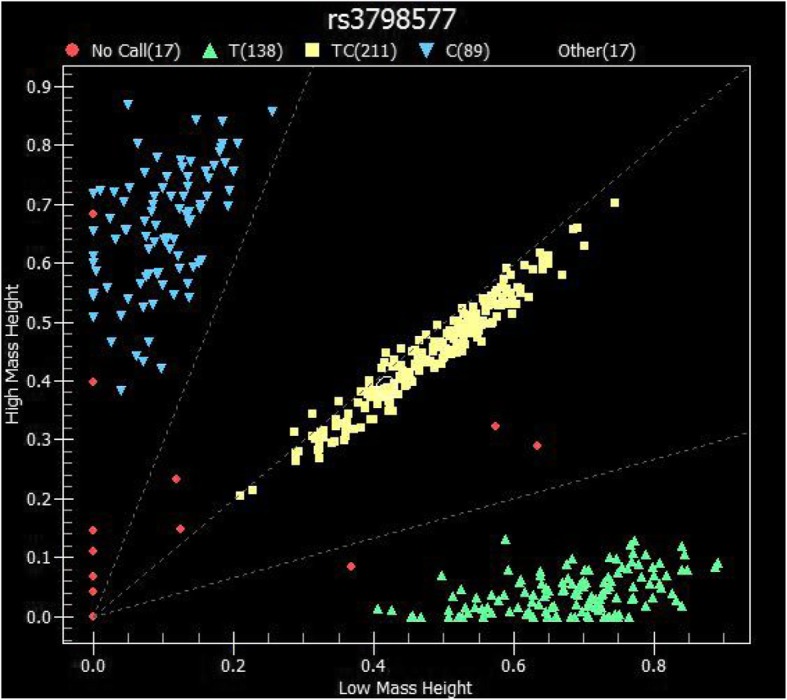
Scatter plot representing Sequenom data for the rs3798577 SNP of the ESR1 gene. Each dot refers to a single sample, and each color indicates a different genotype

Scatter plot representing Sequenom data for the rs3798577 SNP of the ESR1 gene. Each dot refers to a single sample, and each color indicates a different genotype